
Weeks 2 – 3
It’s been a bit of blur the last two weeks, getting to grips with all the activities that go on at the National Crops Resources Research Institute (NaCRRI). I’ve spent time with Dr. Emmanuel Ogwok (Emmy), learning about the earlier days of Cassava brown streak disease (CBSD) research and how things have developed. Emmy took me on a tour to see the greenhouses where they are growing genetically modified cassava, which shows resistance to CBSD.
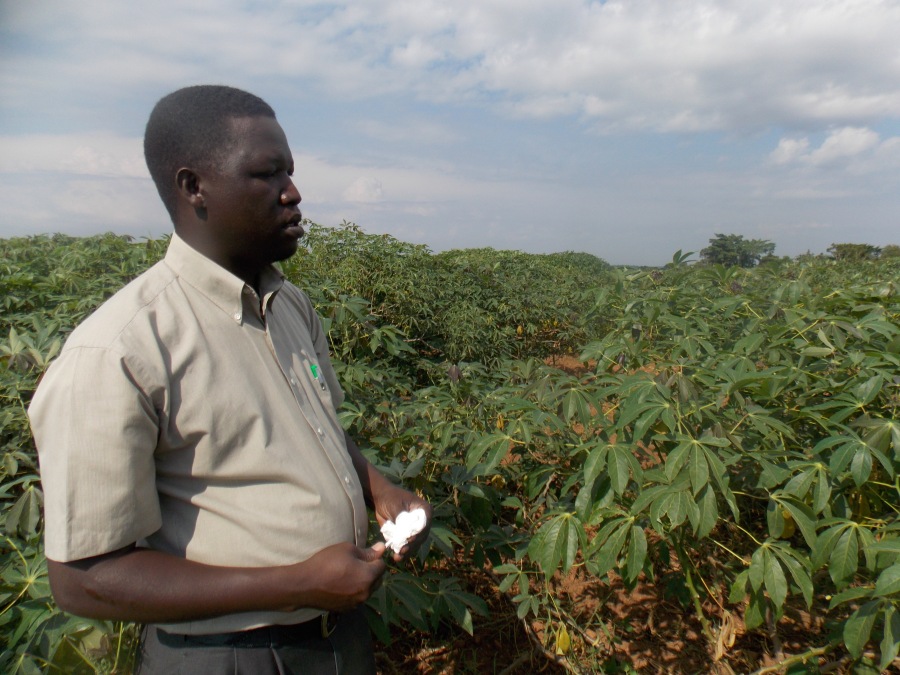 |
| Dr. Emmanuel Ogwok demonstrates how to sample infected cassava from the field |
Diagnosing the problem
Emmy also introduced to me how they diagnose CBSD infections. We headed out to the field and sampled cassava plants showing CBSD symptoms, processed the samples in the lab and bingo, identified the presence of the virus in all the samples by reverse transcription PCR. This is similar to the processes we follow in the UK. It was great to actually sample the infected cassava from the field myself; in the UK we normally use material which was collected years ago.
It was interesting to learn about challenges, such as getting hold of reagents which can take up to three months! The lab is responsible for testing new cassava varieties for their ability to resist CBSD infection and plays a vital role in improving cassava production.
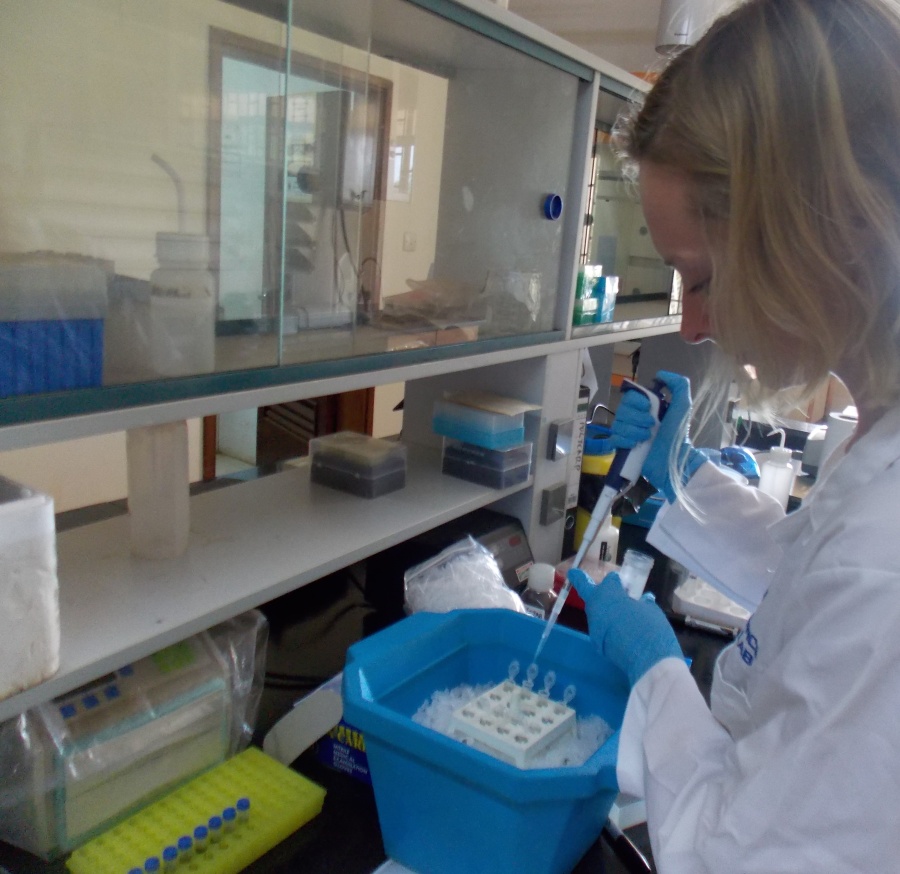 |
| Processing the infected cassava samples from the field |
Communicating the problem
I’ve been working on communication materials to let members of the public know about NaCRRI work at the Source of the Nile agricultural trade show in July. The show will be an opportunity to present and discuss the improved cassava varieties developed by NaCRRI with policy makers, growers and members of the public.
Kampala fun
Outside of work, I’ve been having fun in Kampala; going to arts festivals, watching the football in Ugandan pubs and swimming in the Hotel Africana pool. Next week, I’m planning to visit field sites in northern Uganda, to meet some of the farmers affected by CBSD.
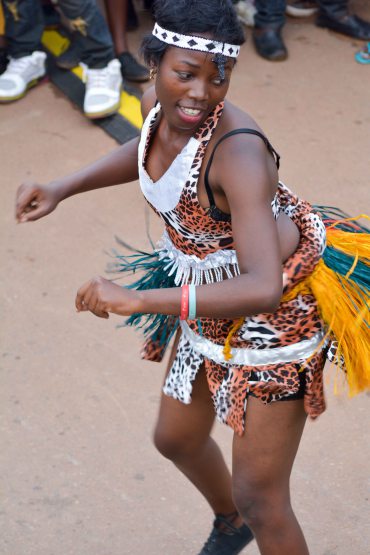 |
| Dancer at La Ba Arts Festival (credit HB Visual) |
-----------------------------------
This blog has been written by University of Bristol Cabot Institute member Katie Tomlinson from the School of Biological Sciences. Katie's area of research is to generate and exploit an improved understanding of cassava brown streak disease (CBSD) to ensure sustainable cassava production in Africa. This blog has been reposted with kind permission from Katie's blog Cassava Virus.
 |
| Katie Tomlinson |
Blog 2: Week one: Settling in to Ugandan life
Blog 3: Learning the ropes
Blog 4: Clean cassava to solve brown streak problem?
Blog 5: Taking a trip to the cassava field!
Blog 6: Using GM to fight cassava brown streak disease
Blog 3: Learning the ropes
Blog 4: Clean cassava to solve brown streak problem?
Blog 5: Taking a trip to the cassava field!
Blog 6: Using GM to fight cassava brown streak disease