 |
| Sub-tropical rainforest in China. Image credit: UMBRELLA project |
Understanding the monsoon is essential. That is why colleagues and I recently reconstructed its behaviour throughout its 145m-year history, in order to better understand how it acts in response to changes in geography or the wider climate in the very long term, and what that might mean for the future.
Our study, published in the journal Science Advances indicates that the East Asian monsoon is much older and more varied than previously thought. Until quite recently the general consensus was that the monsoon came into being around 23m years ago, some time after the Tibetan Plateau was formed.
However, we show that it has been ever present for at least the past 145m years (except during the Late Cretaceous: the era of T. Rex), regardless of whether there was a Tibetan Plateau or how much CO₂ was in the atmosphere.
What is a monsoon?
At its most simple level a monsoon is a highly seasonal distribution in precipitation leading to a distinct “wet” and “dry” seasons – the word even derives from the Arabic “mausim”, translated as “season”.The East Asian monsoon is a “sea breeze monsoon”, the most common type. They form because land and sea heat up at different rates, so high pressure forms over the sea and low pressure over land which results in wind blowing onshore in the summer.
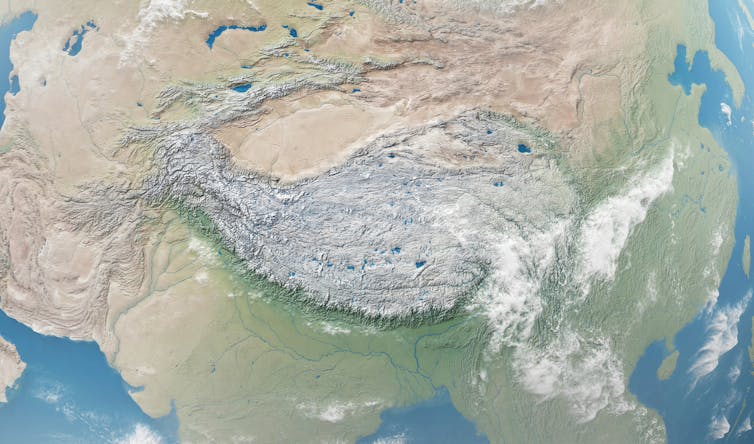
Although The Tibetan Plateau is not strictly needed to form the East Asian monsoon it can serve to enhance it. At 5km or more above sea level, the plateau simply sits much higher in the atmosphere and thus the air above it is heated much more than the same air would be at a lower elevation (consider the ground temperature in Tibet compared to the freezing air 5km above your head). As that Tibetan air is warmer than the surrounding cold air it rises and acts as a heat “pump”, sucking more air in to replace it and enhancing the monsoon circulation.
Changes over the (millions of) years
We found the intensity of the monsoon has varied significantly over the past 145m years. At first, it was around 30% weaker than today. Then, during the Late Cretaceous 100-66m years ago, a huge inland sea covered much of North America and weakened the Pacific trade winds. This caused East Asia to become very arid due to the monsoon disappearing.However, rainfall patterns changed substantially after the Indian tectonic plate collided into the Asian continent around 50m years ago, forming the Himalayas and the Tibetan Plateau. As the land rose up, so did the strength of the monsoon. Our results suggest that 5-10m years ago there were “super-monsoons” with rainfall 30% stronger than today.
But how can we be sure that such changes were caused by geography, and not elevated carbon dioxide concentrations? To test this, we again modelled the climate for all different time periods (roughly every 4m years) and increased or reduced the amount of CO₂ in the atmosphere to see what effect this had on the monsoon. In general, irrespective of time period chosen, the monsoon showed little sensitivity (-1% to +13%) to changes in CO₂ compared to the impact of changes in regional geography.
Climate models are working
The monsoon in East Asia is mainly a result of its favourable geographic position and regional topography – though our work shows that CO₂ concentrations do have an impact, they are secondary to tectonics.The past can help us better understand how the monsoon will behave as the climate changes – but its not a perfect analogue. Although rainfall increased almost every time CO₂ doubled in the past, each of these periods was unique and dependent on the specific geography at the time.
The reassuring thing is that climate models are showing agreement with geological data through the past. That means we have greater confidence that climate models are able to accurately predict how the monsoon will respond over the next century as humans continue to emit more CO₂ into the atmosphere.
-----------------------------
This blog was written by Cabot Institute member Dr Alex Farnsworth, Postdoctoral Research Associate in meteorology at the University of Bristol. This article is republished from The Conversation under a Creative Commons license. Read the original article.
 |
| Alex Farnsworth |

