Carbon
dioxide is the most important greenhouse gas produced by human activities, and
one which is likely to cause significant global climate change if levels
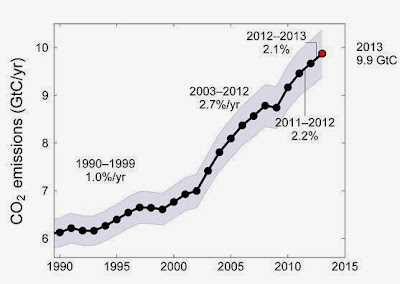
continue to increase at the current rates. This year's Global Carbon Budget holds disappointing yet hardly unexpected
news; in 2012, carbon dioxide (CO2) emissions rose by 2.1% to the
highest levels in human history, a total of 9.7 billion tonnes.
 |
| CDIAC Data; Le Quiere et al 2013. Global Carbon Project 2013. Data not adjusted for leap year. |
The annual
Carbon Budget report is compiled by the Global Carbon Project, a collaboration
of 77 scientists from around the world including the Cabot Institute's own Dr Jo House. They predict that in 2013, global carbon emissions will have increased by a
further 2.1%, setting a new record high.
Major CO2
emitters
China
produced the most CO2 in 2012 (27% of total), which was almost twice
as much as the second worst offender, the USA (14%). The European Union (EU)
contributed 10% of emissions. China's emissions increased 5.9% between 2011 and
2012, whilst the USA and EU continued to decrease their CO2 output
(by 3.7% and 1.3% respectively).
 |
| CDIAC Data; Le Quiere et al 2013. Global Carbon Project 2013. |
While
developing nations like China and India have high levels of greenhouse gas
emissions, it is important to note that per capita the USA has by far the
highest emission rate at 4.4 tonnes of carbon per person per year (tC/p/yr).
China has reached EU levels of 1.9 tC/p/yr, while India produces just
0.5tC/p/yr. Since the Industrial Revolution the USA and Europe still have the
highest cumulative output of CO2 from burning fossil fuels,
something to consider before we become too self-righteous.
 |
| CDIAC Data; Le Quiere et al 2013. Global Carbon Project 2013. |
Carbon
sinks
 |
| Image by Manfred Heyde |
Increased CO2
emissions are absorbed by carbon sinks, specifically the atmosphere, the oceans
and the land. On land, trees and other plants absorb around 27% of emitted CO2
for photosynthesis, which results in more growth and eventually more carbon
stored as leaf litter in the soil.
In the
oceans, algae may absorb some CO2 for photosynthesis (although not
as much as was once hoped), but the water itself absorbs most of the 27% of CO2 stored in
the oceans. Unfortunately when carbon dioxide dissolves in water it can react
to form carbonic acid, a leading cause of ocean acidification. Since the
Industrial Revolution, oceans have become approximately 30% more acidic. If
present trends continue, oceans will be 170% more acidic by 2100, a devastating change for shellfish and corals which rely on an alkaline
calcium carbonate exoskeleton, and the other marine life that depend on these
species.
The
atmosphere absorbs the remaining 45% of CO2 emissions. Over the past
250 years the atmospheric CO2 concentration has risen from 227 parts
per million (ppm) to an average of 393ppm in 2012. Back in May, the first CO2 reading of 400ppm was recorded, a significant milestone in the relentlessly increasing greenhouse gas
levels. We are now on track to see a ‘likely’ 3.2-5.4°C increase in global
temperature by 2100, causing severe droughts and desertification of
agricultural land around the world and flooding of low lying coastal areas.
The Kyoto
protocol
In 1992, 37
industrialised countries agreed to reduce their carbon dioxide emissions by an
average of 5% below 1990 levels during the period of 2008 to 2012. The Global
Carbon Budget reported that whilst some regions such as Europe did reduce their
CO2 output, other areas (eg. Asia, Africa, Middle East) doubled or
even tripled their emissions, resulting in a net gain of 58% more CO2
emissions in 2012 than in 1990.
The biggest
CO2 emitter, China, recently joined almost 200 other countries in
agreeing to sign the pledge to reduce their carbon emissions at a summit in
Paris in 2015. It is hoped that this climate change summit will follow on from the work
started by the Kyoto protocol to reduce CO2 emissions to a more
sustainable level.
What's
your carbon footprint?
We are at a
critical stage in history. The Global Carbon Budget suggests that we have
already produced 70% of the carbon dioxide it is possible to emit without
causing a significant and irreversible change to the planet's climate. It is vital
that all nations work together to reduce carbon emissions to a sustainable
level, preventing a 2°C increase in global
temperature.
If you would
like to calculate your carbon footprint, visit the government's carbon calculator.

