
The recent collapse of a bridge in Grinton, North Yorkshire, raises lots of questions about how prepared we are for these sorts of risks. The bridge, which was due to be on the route of the cycling world championships in September, collapsed after a month’s worth of rain fell in just four hours, causing flash flooding.
Grinton is the latest in a series of such collapses. In 2015, first Storm Eva and then Storm Frank caused flooding which collapsed the 18th century Tadcaster bridge, also in North Yorkshire, and badly damaged the medieval-era Eamont bridge in nearby Cumbria. Floods in 2009 collapsed or severely damaged 29 bridges in Cumbria alone.
With climate change making this sort of intense rainfall more common in future, people are right to wonder whether we’ll see many more such bridge collapses. And if so – which bridges are most at risk?
We know that bridges can collapse for various reasons. Some are simply old and already crumbling. Others fall down because of defective materials or environmental processes such as flooding, corrosion or earthquakes. Bridges have even collapsed after ships crash into them.
Europe’s first major roads and bridges were built by the Romans. This infrastructure developed hugely during the industrial revolution, then much of it was rebuilt and transformed after World War II. But since then, various factors have increased the pressure on bridges and other critical structures.
For instance, when many bridges were first built, traffic mostly consisted of pedestrians, animals and carts – an insignificant load for heavy-weight bridges. Yet over the decades private cars and trucks have got bigger, heavier and faster, while the sheer number of vehicles has massively increased.
In Newcastle, for example, seven bridges over the river Tyne connect the city to the town of Gateshead. These bridges vary in function (pedestrian, road and railway), material (from steel to concrete) and age (17 to 150 years old). The risk and type of failure for each bridge is therefore very different.
Warmer air can hold more moisture and so it is likely that we will see increases in heavy rainfall, like the rain that caused the flash floods at Grinton. High resolution climate models and observational studies also show an intensification of extreme rainfall. This all means that bridge collapse from flooding is more likely in the future.
To reduce future disasters, we need an overview of our infrastructure, including assessments of change of use, ageing and climate change. A national bridge database would enable scientists and engineers to identify and compare risks to bridges across the country, on the basis of threats from climate change.
This blog is written by Cabot Institute member Dr Maria Pregnolato, Lecturer in Civil Engineering, University of Bristol and Elizabeth Lewis, Lecturer in Computational Hydrology, Newcastle University. This article is republished from The Conversation under a Creative Commons license. Read the original article.
Grinton is the latest in a series of such collapses. In 2015, first Storm Eva and then Storm Frank caused flooding which collapsed the 18th century Tadcaster bridge, also in North Yorkshire, and badly damaged the medieval-era Eamont bridge in nearby Cumbria. Floods in 2009 collapsed or severely damaged 29 bridges in Cumbria alone.
With climate change making this sort of intense rainfall more common in future, people are right to wonder whether we’ll see many more such bridge collapses. And if so – which bridges are most at risk?
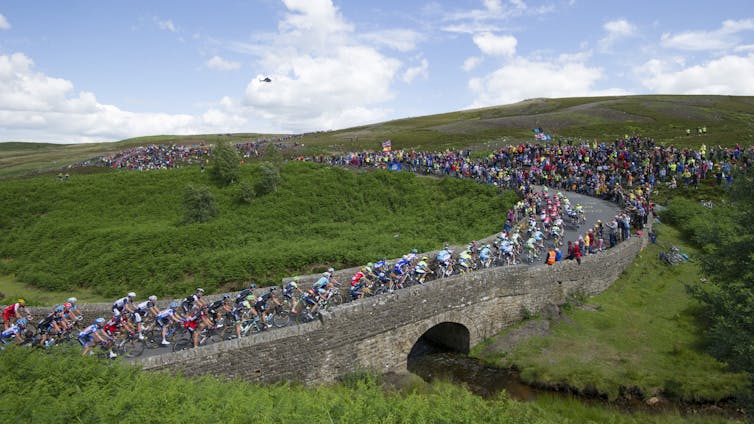 |
| In 2014 the Tour de France passed over the now-destroyed bridge near Grinton. Tim Goode/PA |
Europe’s first major roads and bridges were built by the Romans. This infrastructure developed hugely during the industrial revolution, then much of it was rebuilt and transformed after World War II. But since then, various factors have increased the pressure on bridges and other critical structures.
For instance, when many bridges were first built, traffic mostly consisted of pedestrians, animals and carts – an insignificant load for heavy-weight bridges. Yet over the decades private cars and trucks have got bigger, heavier and faster, while the sheer number of vehicles has massively increased.
Different bridges run different risks
Engineers in many countries think that numerous bridges could have reached the end of their expected life spans (between 50-100 years). However, we do not know which bridges are most at risk. This is because there is no national database or method for identifying structures at risk. Since different types of bridges are sensitive to different failure mechanisms, having awareness of the bridge stock is the first step for an effective risk management of the assets.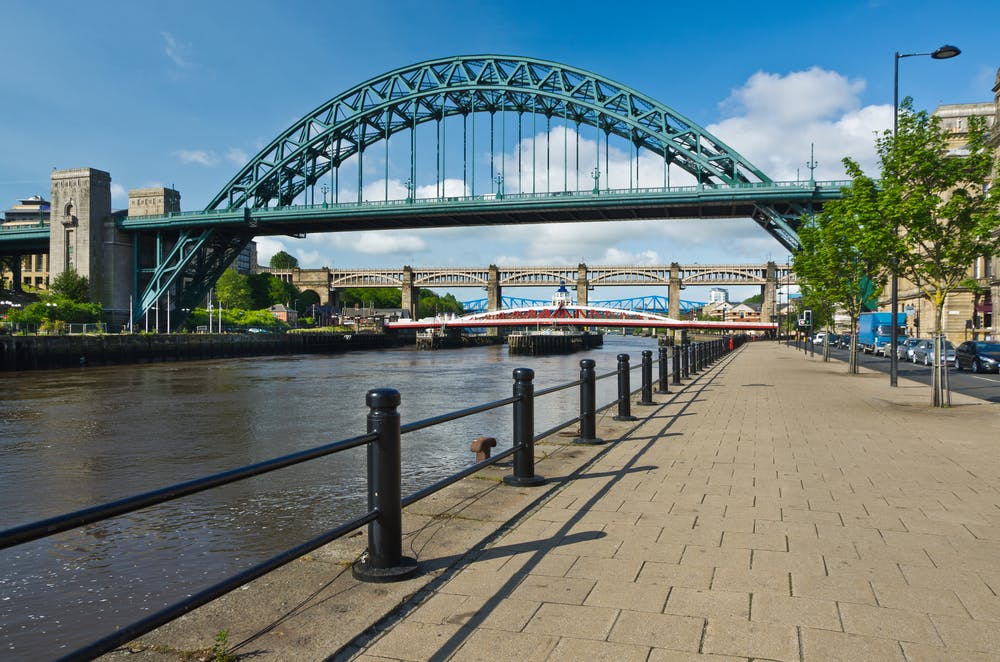 |
| Newcastle’s various bridges all have different risks. Shaun Dodds / shutterstock |
In Newcastle, for example, seven bridges over the river Tyne connect the city to the town of Gateshead. These bridges vary in function (pedestrian, road and railway), material (from steel to concrete) and age (17 to 150 years old). The risk and type of failure for each bridge is therefore very different.
Intense rain will become more common
Flooding is recognised as a major threat in the UK’s National Risk Register of Civil Emergencies. And though the Met Office’s latest set of climate projections shows an increase in average rainfall in winter and a decrease in average rainfall in summer, rainfall is naturally very variable. Flooding is caused by particularly heavy rain so it is important to look at how the extremes are changing, not just the averages.Warmer air can hold more moisture and so it is likely that we will see increases in heavy rainfall, like the rain that caused the flash floods at Grinton. High resolution climate models and observational studies also show an intensification of extreme rainfall. This all means that bridge collapse from flooding is more likely in the future.
To reduce future disasters, we need an overview of our infrastructure, including assessments of change of use, ageing and climate change. A national bridge database would enable scientists and engineers to identify and compare risks to bridges across the country, on the basis of threats from climate change.
This blog is written by Cabot Institute member Dr Maria Pregnolato, Lecturer in Civil Engineering, University of Bristol and Elizabeth Lewis, Lecturer in Computational Hydrology, Newcastle University. This article is republished from The Conversation under a Creative Commons license. Read the original article.
 |
| Dr Maria Pregnolato |