
Many numbers are swirling around the climate negotiations at the UN climate summit in Glasgow, COP26. These include global warming targets of 1.5℃ and 2.0℃, recent warming of 1.1℃, remaining CO₂ budget of 400 billion tonnes, or current atmospheric CO₂ of 415 parts per million.
It’s often hard to grasp the significance of these numbers. But the study of ancient climates can give us an appreciation of their scale compared to what has occurred naturally in the past. Our knowledge of ancient climate change also allows scientists to calibrate their models and therefore improve predictions of what the future may hold.
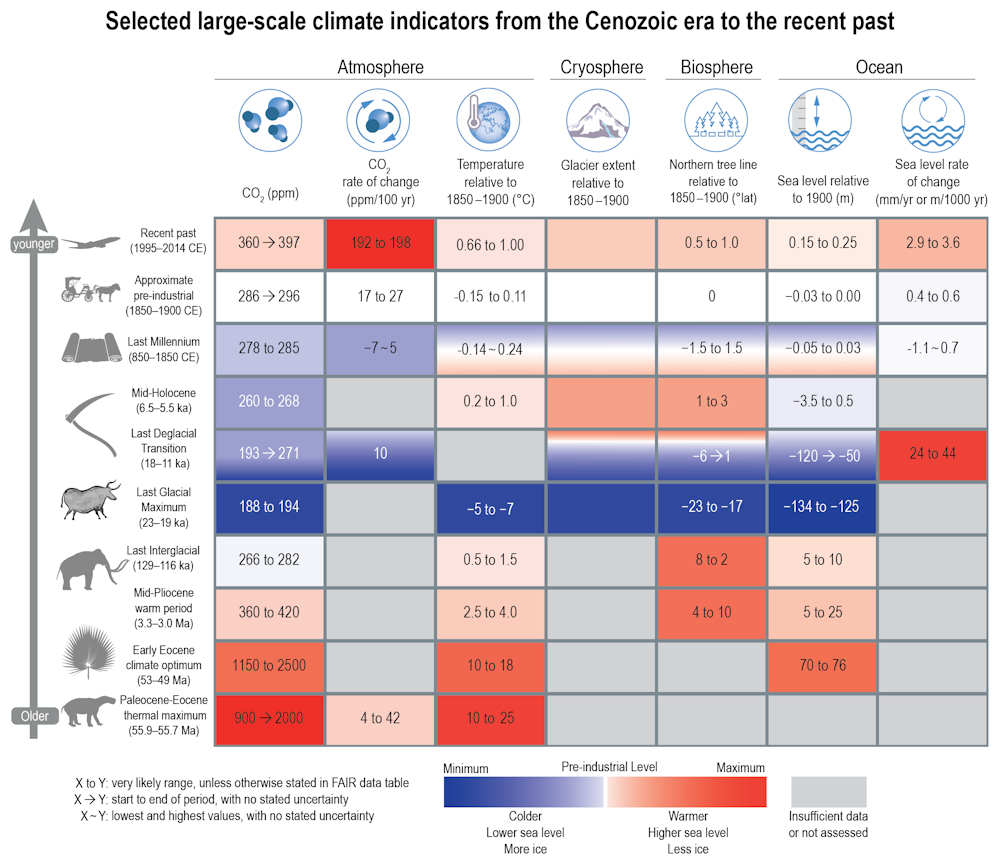
Recent work, summarised in the latest report of the Intergovernmental Panel on Climate Change (IPCC), has allowed scientists to refine their understanding and measurement of past climate changes. These changes are recorded in rocky outcrops, sediments from the ocean floor and lakes, in polar ice sheets, and in other shorter-term archives such as tree rings and corals. As scientists discover more of these archives and get better at using them, we have become increasingly able to compare recent and future climate change with what has happened in the past, and to provide important context to the numbers involved in climate negotiations.
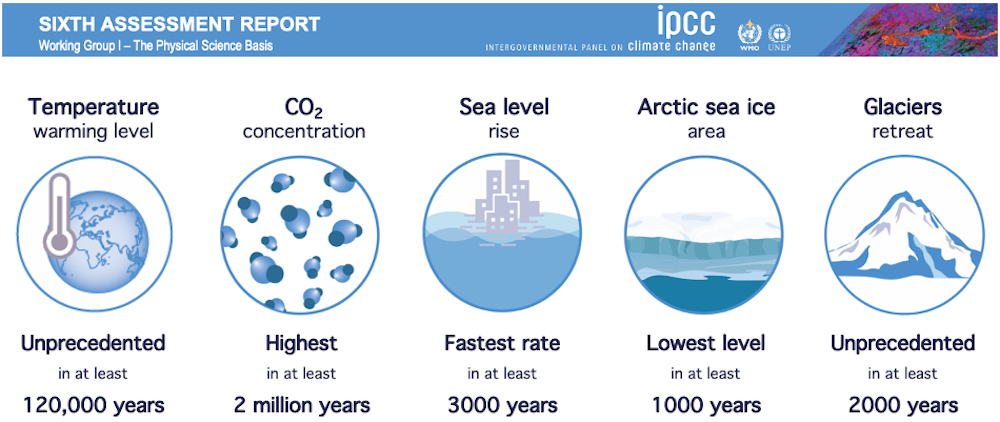
For instance one headline finding in the IPCC report was that global temperature (currently 1.1℃ above a pre-industrial baseline) is higher than at any time in at least the past 120,000 or so years. That’s because the last warm period between ice ages peaked about 125,000 years ago – in contrast to today, warmth at that time was driven not by CO₂, but by changes in Earth’s orbit and spin axis. Another finding regards the rate of current warming, which is faster than at any time in the past 2,000 years – and probably much longer.
But it is not only past temperature that can be reconstructed from the geological record. For instance, tiny gas bubbles trapped in Antarctic ice can record atmospheric CO₂ concentrations back to 800,000 years ago. Beyond that, scientists can turn to microscopic fossils preserved in seabed sediments. These properties (such as the types of elements that make up the fossil shells) are related to how much CO₂ was in the ocean when the fossilised organisms were alive, which itself is related to how much was in the atmosphere. As we get better at using these “proxies” for atmospheric CO₂, recent work has shown that the current atmospheric CO₂ concentration of around 415 parts per million (compared to 280 ppm prior to industrialisation in the early 1800s), is greater than at any time in at least the past 2 million years.
Other climate variables can also be compared to past changes. These include the greenhouse gases methane and nitrous oxide (now greater than at any time in at least 800,000 years), late summer Arctic sea ice area (smaller than at any time in at least the past 1,000 years), glacier retreat (unprecedented in at least 2,000 years) sea level (rising faster than at any point in at least 3,000 years), and ocean acidity (unusually acidic compared to the past 2 million years).
In addition, changes predicted by climate models can be compared to the past. For instance an “intermediate” amount of emissions will likely lead to global warming of between 2.3°C and 4.6°C by the year 2300, which is similar to the mid-Pliocene warm period of about 3.2 million years ago. Extremely high emissions would lead to warming of somewhere between 6.6°C and 14.1°C, which just overlaps with the warmest period since the demise of the dinosaurs – the “Paleocene-Eocene Thermal Maximum” kicked off by massive volcanic eruptions about 55 million years ago. As such, humanity is currently on the path to compressing millions of years of temperature change into just a couple of centuries.

Distant past can held predict the near future
For the first time in an IPCC report, the latest report uses ancient time periods to refine projections of climate change. In previous IPCC reports, future projections have been produced simply by averaging results from all climate models, and using their spread as a measure of uncertainty. But for this new report, temperature and rainfall and sea level projections relied more heavily on those models that did the best job of simulating known climate changes.
Part of this process was based on each individual model’s “climate sensitivity” – the amount it warms when atmospheric CO₂ is doubled. The “correct” value (and uncertainty range) of sensitivity is known from a number of different lines of evidence, one of which comes from certain times in the ancient past when global temperature changes were driven by natural changes in CO₂, caused for example by volcanic eruptions or change in the amount of carbon removed from the atmosphere as rocks are eroded away. Combining estimates of ancient CO₂ and temperature therefore allows scientists to estimate the “correct” value of climate sensitivity, and so refine their future projections by relying more heavily on those models with more accurate climate sensitivities.
Overall, past climates show us that recent changes across all aspects of the Earth system are unprecedented in at least thousands of years. Unless emissions are reduced rapidly and dramatically, global warming will reach a level that has not been seen for millions of years. Let’s hope those attending COP26 are listening to messages from the past.
------------------------------
This blog is written by Cabot Institute for the Environment member Dan Lunt, Professor of Climate Science, University of Bristol and Darrell Kaufman, Professor of Earth and Environmental Sciences, Northern Arizona University
This article is republished from The Conversation under a Creative Commons license. Read the original article.
 |
| Dan Lunt |
Read all blogs in our COP26 blog series:
