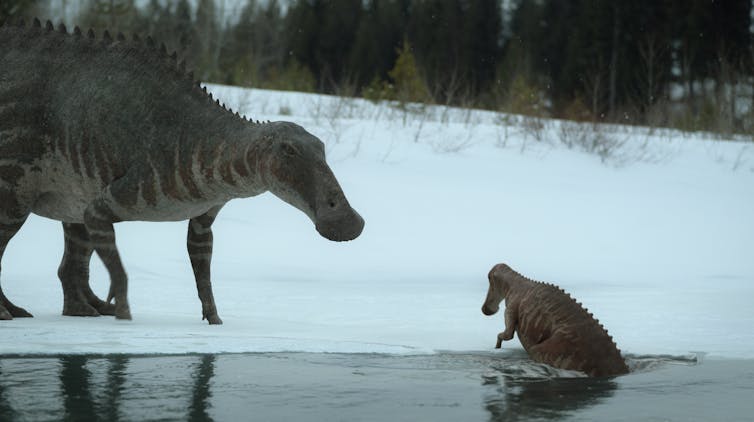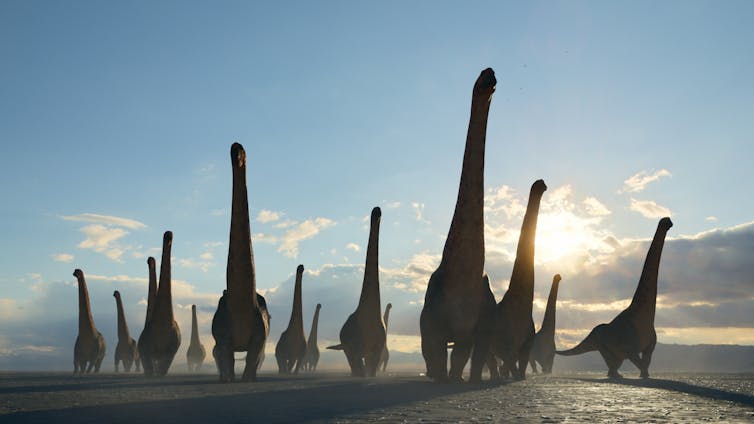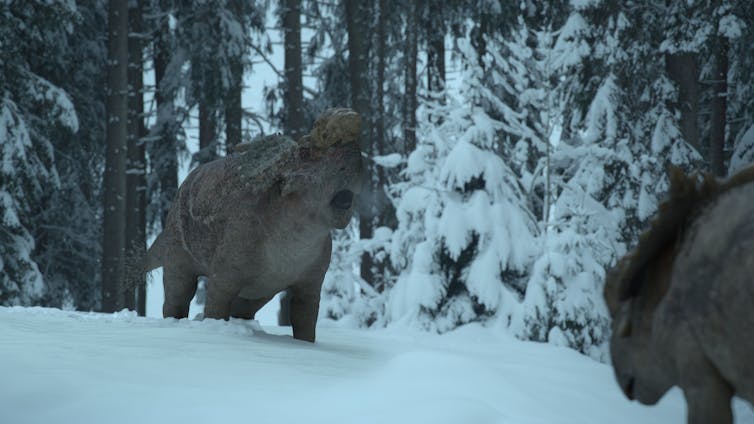
When conjuring up images of when dinosaurs ruled the planet we often think of hot and humid landscapes in a world very different from our own. However, the new TV series Prehistoric Planet, narrated by Sir David Attenborough, shows dinosaurs living and indeed thriving in many types of environments, including colder regions where snowstorms, freezing fog and sea-ice were commonplace.
When the show’s producers first approached us to help understand the kinds of weather and environment that dinosaurs lived in before being wiped out around 66 million years ago, it prompted us to tackle a problem that has existed in palaeoclimate modelling for decades. That was, when scientists like us used computers to simulate, or “model”, the climate of prehistoric Earth, the models tended to make the poles much colder than evidence from fossils and rocks suggested they had actually been.
For the TV series, not only have we improved our models, but we have run the computer programmes for longer than anybody else has ever done to get the models as close to ancient “reality” as possible.

The producers, the BBC’s Natural History Unit, needed to know about the weather so they could film “real world” locations similar to those that existed in the past where dinosaurs lived. But most of what we know about the climate that long ago comes from indirect “proxy” evidence, such as leaf fossils and traces of certain chemicals in rocks, which can only reconstruct the average climate over decades or centuries. This is where the narrative of a much hotter and more humid Cretaceous world comes from.
This narrative isn’t exactly wrong, but it doesn’t tell the whole story since weather and climate behave differently. For instance, even in today’s warming world a place like Texas, largely hot and humid, recently experienced widespread snowfall. Geologists a million years from now will spot the sudden global warming – but not the freak snowstorm. Nonetheless, modelling the the prehistoric equivalent of these snowstorms is important since we know warmer worlds will experience greater weather extremes. And these extremes will have largely determined which regions were completely inhospitable to dinosaurs.
How do we know what the weather was like?
Unfortunately, although fossils give us many clues as to past climate, most cannot directly tell us what the weather was on a day to day basis.
So, for a given place on Earth, how do we know what the weather was on, say, May 27 some 66 million years ago? To do this we need to employ a computer simulation of the climate, similar to the ones used to look at future climate change today. These models are based on fundamental physical and biological processes which remain constant with time. It is therefore possible to adjust them for ancient worlds, even if we don’t know precise details like where or how high the mountains were, or exactly how much carbon dioxide was in the atmosphere.
We can then check these models using some of the ancient climate proxies, such as fossilised leaves, coral or rocks which contain traces of what conditions were like at the time. If our model matches up with the proxies – and it did – then we can be confident it is simulating typical weather at the time.
So what did we learn from modelling the climate of 66m years ago?
Our model found there would have been intense blizzards in Antarctica, for instance, “category six” hurricanes (something we are likely to see in our lifetimes) buffeting the mid and low latitudes and extensive, ever present, fog banks creating murky winters under polar cloud caps.
This doesn’t immediately sound like a dinosaur-friendly environment. However, the old misconception that dinosaurs were cold blooded, thus requiring a warm climate for survival has for the most part already been dismissed. The new paradigm is that dinosaurs were warm blooded, and could to some extent regulate their internal temperature, like mammals do today.
This would be essential to survive large swings in temperature, driven by varied weather patterns, particularly in the polar regions. Our modelling therefore backs up recent fossil discoveries which show that some dinosaur species were cold-adapted, could see in low light conditions (useful in those huge fog banks), and thrived year-round near the poles.

The Prehistoric Planet scenes with the chilly Pachyrhinosaurus were set in Alaska, and demonstrate why the show wanted check its accuracy with climate models. We have an idea what the conditions would have been like there 66m years ago thanks to detailed fossils of plants, dinosaurs and other animals, yet the old models would have predicted intensely-cold and lifeless tundra.
Our model instead matches up with the fossil evidence, and predicts forests right up to the margins of the Arctic Ocean at 82°N – much further north than any trees today. In the summer, dinosaur food would have been abundant, but in the long dark winters it would have been more difficult to find, particularly as both fossils and modelling suggests it was so foggy.
Dinosaurs survived for a remarkable 165 million years. Tyrannosaurus Rex lived much closer to present day humans than it did to Stegosauruses, for instance. They managed to survive so long because they were resilient and adaptable to changeable environmental conditions, much like mammals are today. Our work for Prehistoric Planet shows that they were able to survive through greater extremes in temperature, stormier weather, and more extreme droughts than humans have experienced – so far.![]()
--------------------------
This blog is written by Cabot Institute for the Environment members Dr Alex Farnsworth, Senior Research Associate in Meteorology, and Paul Valdes, Professor of Physical Geography, University of Bristol; and Robert Spicer, Emeritus Professor of Earth Sciences, The Open University
This article is republished from The Conversation under a Creative Commons license. Read the original article.
 |
| Alex Farnsworth |
 |
| Paul Valdes |
