 |
| NERC’s BAe-146 research aircraft at the Facility for Airborne Atmospheric Measurements (FAAM). Image credit: FAAM |
This summer, researchers across the UK and
India are teaming up to study the Indian monsoon as part of a £8 million observational campaign using the NERC research aircraftBAe-146.
India receives 80% of its annual rainfall in three months – between
June and September. There are large year-to-year differences in the strength of
the monsoon, which is heavily impacted by drivers such as aerosols and
large-scale weather patterns, and this has significant impact on the
livelihoods of over a billion people. For example, due to the strong El Nino
last year, the 2015 monsoon experienced a 14% lower precipitation than average
with some regions of India facing up to 50% shortfall. Forecasting the timing and strength of the
monsoon is critical for the region and particularly for India’s farmers, who
must manage water resources to avoid failing crops.
 |
Roadside mural of the BAe-146 in
Bangalore, India. Original artist unknown.
Image credit: Guy Gratton
|
The observational campaign, which is part
of NERC’s Drivers of Variability in the South Asian Monsoon programme, is led
jointly by UK researchers: Professor Hugh Coe (University of Manchester), Dr
Andy Turner (University of Reading) and Dr Adrian Matthews (University of East
Anglia) and Indian scientists from the Indian Space Research Organization and
Indian Institute of Science.
 |
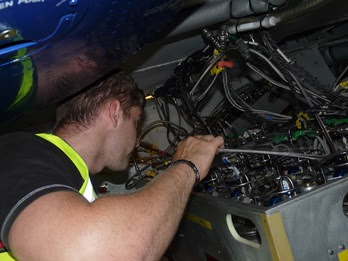
| Bristol PhD student Dan Say installing sample containers on the BAe- 146. Image credit: Angelina Wenger |
Two of the
greenhouse gases that we are studying, methane and nitrous oxide, are primarily
produced during the monsoon season from India’s intensive agriculture. Methane
is emitted from rice paddies, in which flooded soils create prime conditions
for “anaerobic” methane production. Nitrous oxide is also emitted from these
flooded soils due the large quantity of fertilizers that are applied, again through anaerobic pathways.
Our previous understanding
of the large-scale emissions of these greenhouse gases from India’s agricultural
soils has been limited and we aim to further our knowledge of what controls
their production. In addition to the methane concentrations measured on the
aircraft, with collaborators at the Royal Holloway, University of London’s
isotope facility, we are also measuring the main isotope of methane (the
13-carbon isotope), which will provide us with a valuable tool for differentiating between agricultural and other sources of methane in
the region. By combining this information with other measurements from the
aircraft (for example, of moisture and of other atmospheric pollutants), we aim
to gain new insights on how we may reduce these emissions in the future.
 |
| Rice fields near Bangalore, India. Image credit: Guy Gratton. |
In addition, many synthetic “man-made” greenhouse gases are being
measured for the first time in South Asia, giving us the first look at
emissions from this region of some of the most potent warming agents. These
include the suite of halocarbons such as hydrofluorocarbons (HFCs) and their
predecessors the hydrochlorofluorocarbons (HCFCs) and chlorofluorocarbons (CFCs).
These gases will be measured on the University of Bristol School of Chemistry’s ‘Medusa’ gaschromatography-mass spectrometer (GC-MS) facility
run by Professor Simon O’Doherty.
 |
| Sample canisters for collecting air that will be measured on the School of Chemistry’s ‘Medusa’ GC-MS facility. Image credit: Angelina Wenger |
This blog is written by University of Bristol Cabot Institute member Dr Anita Ganesan, a NERC Research
Fellow, School of
Geographical Sciences, who looks at greenhouse gas emissions estimation.
| Anita Ganesan |
