
 |
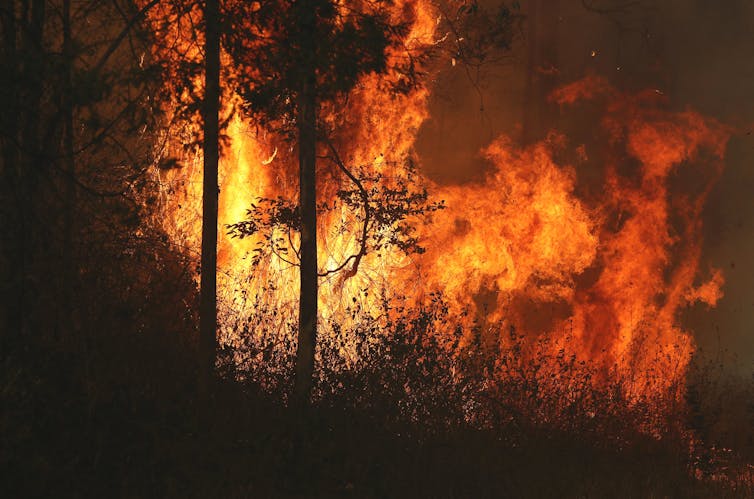
| Exposing people to likely disinformation campaigns about bushfire causes will help inoculate them. JASON O'BRIEN/AAP |
Australia’s recent bushfire crisis will be remembered for many things – not least, the tragic loss of life, property and landscape. But one other factor made it remarkable: the deluge of disinformation spread by climate deniers.
As climate change worsens – and with it, the bushfire risk – it’s well worth considering how to protect the public against disinformation campaigns in future fire seasons.
So how do we persuade people not to be fooled? One promising answer lies in a branch of psychology called “inoculation theory”. The logic is analogous to the way a medical vaccine works: you can prevent a virus spreading by giving lots of people a small dose.
In the case of bushfire disinformation, this means exposing, ahead of time, the myths most likely to be perpetrated by sceptics.
Bushfire bunkum
Disinformation can take many forms, including cherry-picking or distorting data, questioning of the scientific consensus by presenting fake experts, and outright fabrication.
On the issue of bushfires in Australia, there is little scientific doubt that human-caused climate change is increasing their magnitude and frequency. But spurious claims on social media and elsewhere of late sought to muddy the waters:
- bots and trolls disseminated false arson claims which downplayed the impact of climate change on the bushfires
- NewsCorp reported more than 180 arsonists had been arrested “in the past few months”. The figure was a gross exaggeration and distorted the real numbers
- The misleading arson claim went viral after Donald Trump Jr, the president’s son, tweeted it. A UK government minister, Heather Wheeler, also repeated the false claim in the House of Commons
- NSW Nationals leader John Barilaro, among others, wrongly suggested a lack of hazard reduction burning – the fault of the Greens – had caused the fires
- Conservative commentators claimed the 2019-20 bushfires were no worse than those of the past.
Where will it go next?
Research has repeatedly shown that if the public knows, ahead of time, what disinformation they are likely to encounter and why it is wrong, they are less likely to accept it as true.
This inoculation involves two elements: an explicit warning of an impending attempt to misinform, and a refutation of the anticipated disinformation.
For example, research has shown that if people were told how the tobacco industry used fake experts to mislead the public about the health risks of smoking, they were less likely to be misled by similar strategies used to deny climate change.
It is therefore important to anticipate the next stage of disinformation about the causes of bushfire disasters. One likely strategy will be to confuse the public by exploiting the role of natural climate variability.
This tactic has been used before. When natural variability slowed global warming in the early 2000s, some falsely claimed that global warming “had stopped”.
Of course, the warming never stopped – an unexceptional natural fluctuation merely slowed the process, which subsequently resumed.
Natural climate variability may bring the occasional mild fire season in future. So let's arm ourselves with the facts to combat the inevitable attempts to mislead.
Here are the facts
The link between human-caused climate change and extreme weather conditions is well established. But natural variability, such as El Niño and La Niña events in the Pacific Ocean may at times overshadow global warming for a few years.The below video illustrates this. We used historical data from Adelaide to project the expected incidence of extreme heatwaves for the rest of the century, assuming a continued warming trend of 0.3℃ per decade.
The top panel shows the distribution of all 365 daily maximum temperatures for a year, with the annual average represented by the vertical red line. As the years tick over, this distribution is moving up slowly; the red line increasingly diverges from the average temperature observed before the climate started changing (the vertical black line).
The bottom panel shows the expected incidence of extreme heatwaves for each year until 2100. Each vertical line represents an intense heatwave (five consecutive days in excess of 35℃ or three days in excess of 40℃). Each heatwave amplifies the fire danger in that year.
The analysis in the video clarifies several important aspects of climate change:
- the number and frequency of extreme heatwaves will increase as the climate continues to warm
- for the next few decades at least, years with heatwaves may be followed by one or more years without one
- the respite will only be brief because the inexorable global warming trend makes extreme fire conditions more and more inevitable.
Looking ahead
When it comes to monster bushfire seasons, the link to climate change is undeniable. This season’s inferno is a sign of worse to come – even if it doesn’t happen every year.Educating the public on climate science, and the tactics used by disinformers, increases the chance that “alternative facts” do not gain traction.
Hopefully, this will banish disinformation to the background of public debate, paving the way for meaningful policy solutions.
---------------------------------------------
This blog is written by Cabot Institute member Professor Stephan Lewandowsky, Chair of Cognitive Psychology, University of Bristol and John Hunter, University Associate, Institute for Marine and Antarctic Studies, University of Tasmania. This article is republished from The Conversation under a Creative Commons license. Read the original article.