New flood maps show US damage rising 26% in next 30 years due to climate change alone, and the inequity is stark

Climate change is raising flood risks in neighborhoods across the U.S. much faster than many people realize. Over the next three decades, the cost of flood damage is on pace to rise 26% due to climate change alone, an analysis of our new flood risk maps shows.
That’s only part of the risk. Despite recent devastating floods, people are still building in high-risk areas. With population growth factored in, we found the increase in U.S. flood losses will be four times higher than the climate-only effect.
Our team develops cutting-edge flood risk maps that incorporate climate change. It’s the data that drives local risk estimates you’re likely to see on real estate websites.
In the new analysis, published Jan. 31, 2022, we estimated where flood risk is rising fastest and who is in harm’s way. The results show the high costs of flooding and lay bare the inequities of who has to endure America’s crippling flood problem. They also show the importance of altering development patterns now.
The role of climate change
Flooding is the most frequent and costliest natural disaster in the United States, and its costs are projected to rise as the climate warms. Decades of measurements, computer models and basic physics all point to increasing precipitation and sea level rise.
As the atmosphere warms, it holds about 7% more moisture for every degree Celsius that the temperature rises, meaning more moisture is available to fall as rain, potentially raising the risk of inland flooding. A warmer climate also leads to rising sea levels and higher storm surges as land ice melts and warming ocean water expands.
Yet, translating that understanding into the detailed impact of future flooding has been beyond the grasp of existing flood mapping approaches.
Previous efforts to link climate change to flood models offered only a broad view of the threat and didn’t zoom in close enough to provide reliable measures of local risk, although they could illustrate the general direction of change. Most local flood maps, such as those produced by the Federal Emergency Management Agency, have a different problem: They’re based on historical changes rather than incorporating the risks ahead, and the government is slow to update them.
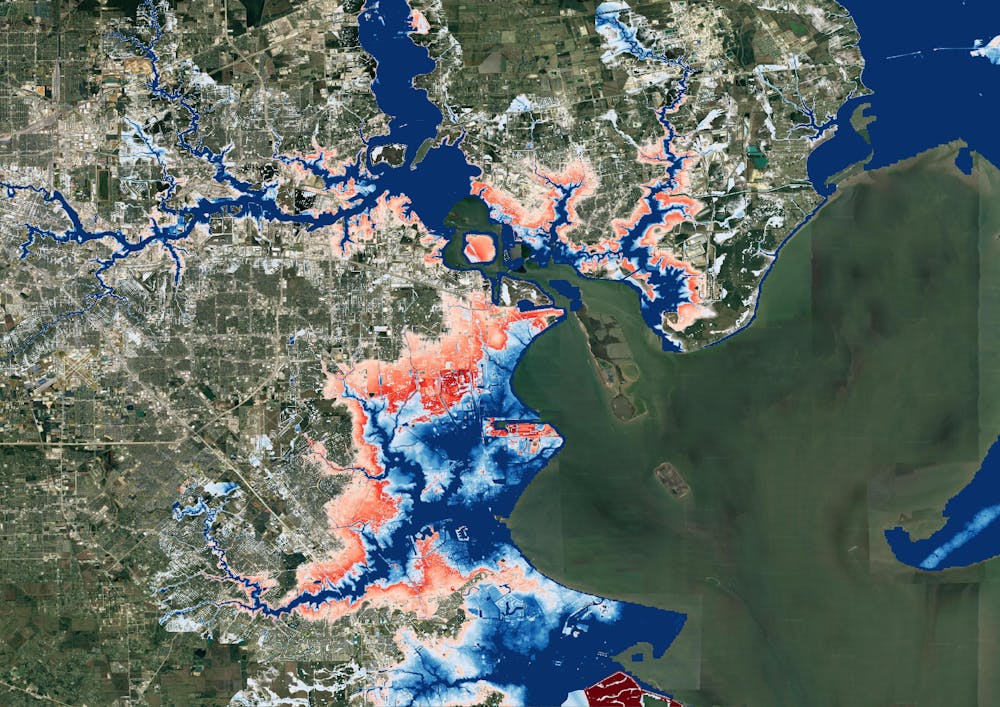
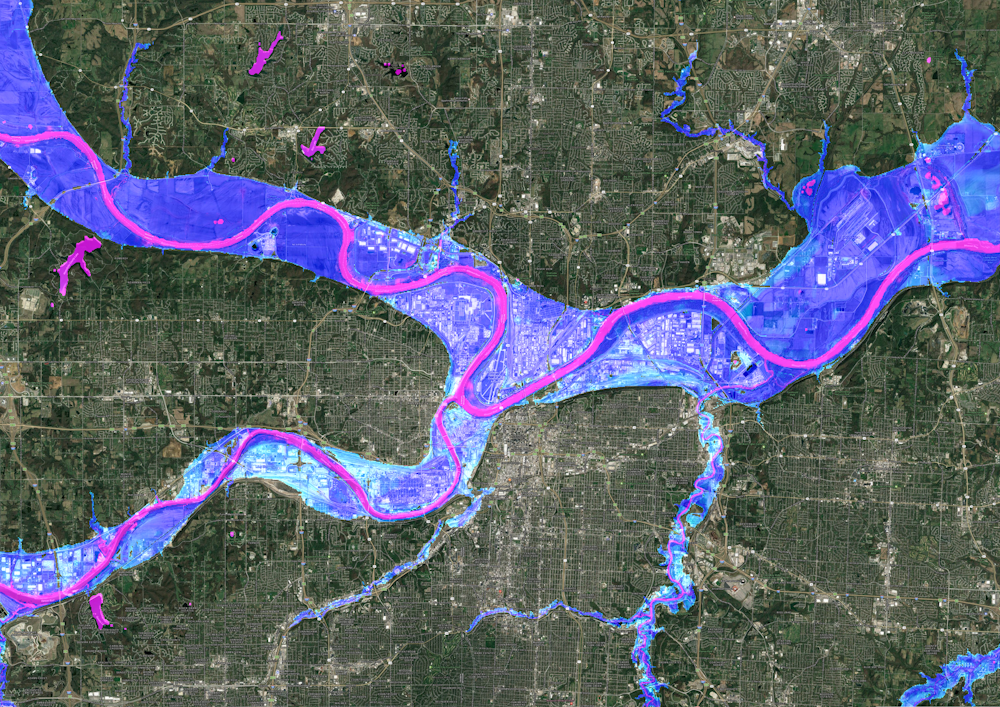
Our maps account for flooding from rivers, rainfall and the oceans – both now and into the future – across the entire contiguous United States. They are produced at scales that show street-by-street impacts, and unlike FEMA maps, they cover floods of many different sizes, from nuisance flooding that may occur every few years to once-in-a-millennium disasters.
While hazard maps only show where floods might occur, our new risk analysis combines that with data on the U.S. building stock to understand the damage that occurs when floodwaters collide with homes and businesses. It’s the first validated analysis of climate-driven flood risk for the U.S.
The inequity of America’s flood problem
We estimated that the annual cost of flooding today is over US$32 billion nationwide, with an outsized burden on communities in Appalachia, the Gulf Coast and the Northwest.
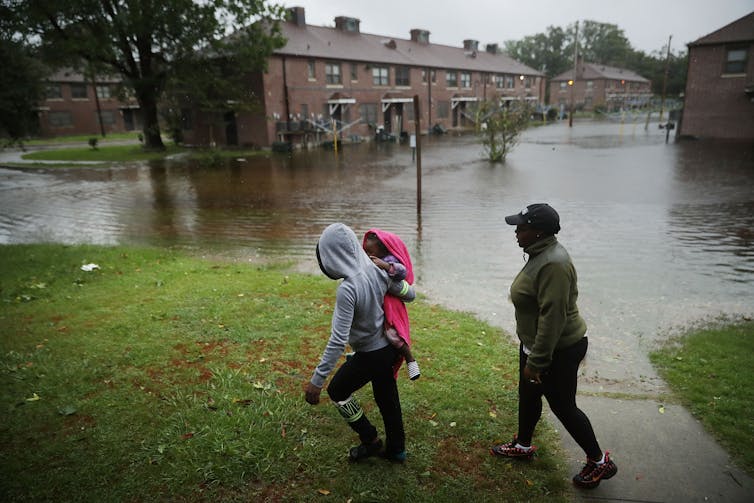
When we looked at demographics, we found that today’s flood risk is predominantly concentrated in white, impoverished communities. Many of these are in low-lying areas directly on the coasts or Appalachian valleys at risk from heavy rainfall.
But the increase in risk as rising oceans reach farther inland during storms and high tides over the next 30 years falls disproportionately on communities with large African American populations on the Atlantic and Gulf coasts. Urban and rural areas from Texas to Florida to Virginia contain predominantly Black communities projected to see at least a 20% increase in flood risk over the next 30 years.
Historically, poorer communities haven’t seen as much investment in flood adaptation or infrastructure, leaving them more exposed. The new data, reflecting the cost of damage, contradicts a common misconception that flood risk exacerbated by sea level rise is concentrated in whiter, wealthier areas.
Our findings raise policy questions about disaster recovery. Prior research has found that these groups recover less quickly than more privileged residents and that disasters can further exacerbate existing inequities. Current federal disaster aid disproportionately helps wealthier residents. Without financial safety nets, disasters can be tipping points into financial stress or deeper poverty.
Population growth is a major driver of flood risk
Another important contributor to flood risk is the growing population.
As urban areas expand, people are building in riskier locations, including expanding into existing floodplains – areas that were already at risk of flooding, even in a stable climate. That’s making adapting to the rising climate risks even more difficult.
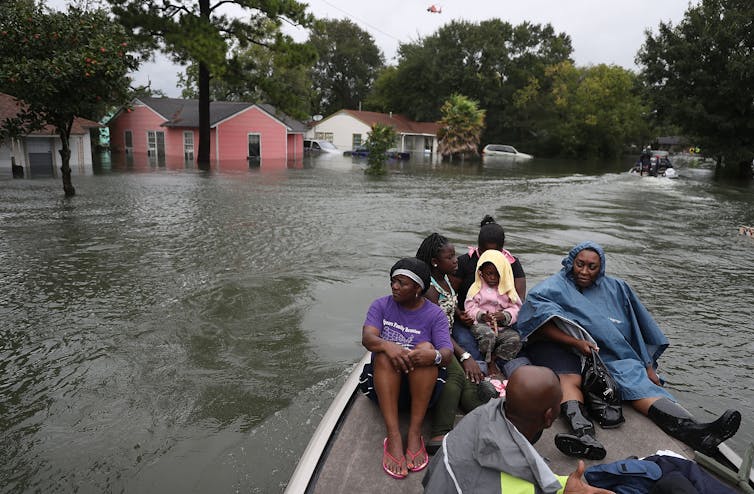
Hurricane Harvey made that risk painfully clear when its record rainfall sent two reservoirs spilling into neighborhoods, inundating homes that had been built in the reservoirs’ flood zones. That was in 2017, and communities in Houston are rebuilding in risky areas again.
We integrated into our model predictions how and where the increasing numbers of people will live in order to assess their future flood risk. The result: Future development patterns have a four times greater impact on 2050 flood risk than climate change alone.
On borrowed time
If these results seem alarming, consider that these are conservative estimates. We used a middle-of-the-road trajectory for atmospheric greenhouse gas concentrations, one in which global carbon emissions peak in the 2040s and then fall.
Importantly, much of this impact over the next three decades is already locked into the climate system. While cutting emissions now is crucial to slow the rate of sea level rise and reduce future flood risk, adaptation is required to protect against the losses we project to 2050.
[Over 140,000 readers rely on The Conversation’s newsletters to understand the world. Sign up today.]
If future development was directed outside of the riskiest areas, and new construction met higher standards for flood mitigation, some of these projected losses could be avoided. In previous research, we found that for a third of currently undeveloped U.S. floodplains it is cheaper to buy the land at today’s prices and preserve it for recreation and wildlife than develop it and pay for the inevitable flood damages later.
The results stress how critical land use and building codes are when it comes to adapting to climate change and managing future losses from increasing climate extremes. Protecting lives and property will mean moving existing populations out of harm’s way and stopping new construction in flood-risk areas.![]()
-------------------------------
This blog is written by Cabot Institute for the Environment members Dr Oliver Wing, Research Fellow, and Paul Bates, Professor of Hydrology, School of Geographical Sciences, University of Bristol; and Carolyn Kousky, Executive Director, Wharton Risk Center, University of Pennsylvania and Jeremy Porter, Professor of Quantitative Methods in the Social Sciences, City University of New York.
This article is republished from The Conversation under a Creative Commons license. Read the original article.