Climate change isn’t just making cyclones worse, it’s making the floods they cause worse too - new research

Super cyclones, known as hurricanes or typhoons in different parts of the world, are among the most destructive weather events on our planet.
Although wind speeds within these storms can reach 270 km/h, the largest loss of life comes from the flooding they cause – known as a “storm surge” – when sea water is pushed onto the coast. Climate change is predicted to worsen these floods, swelling cyclone clouds with more water and driving rising sea levels that allow storm surges to be blown further inland.
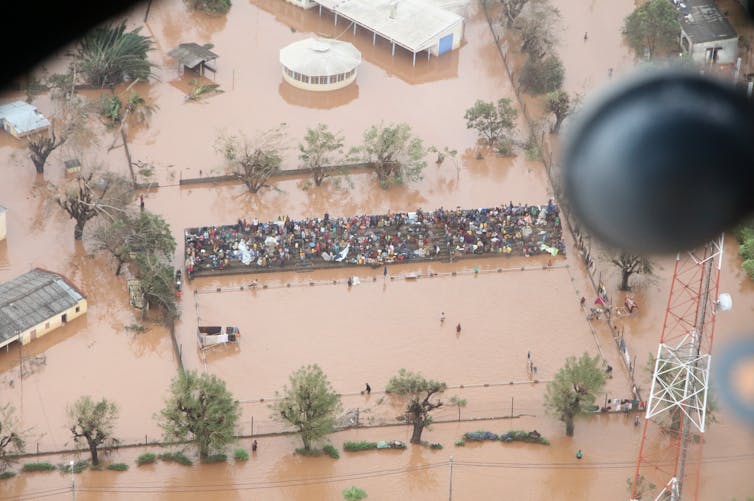
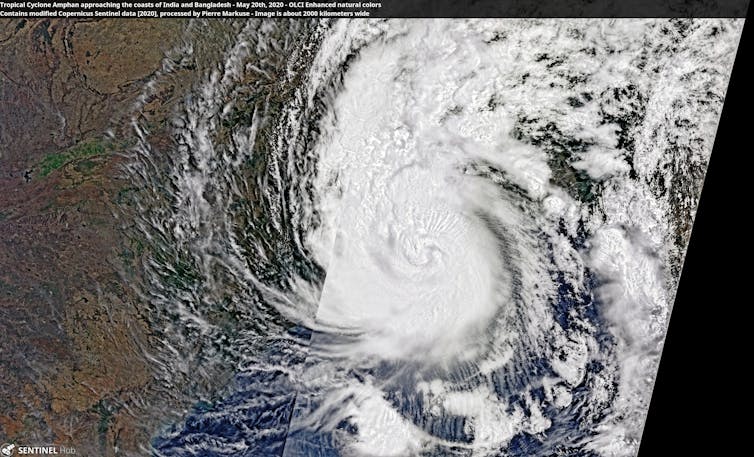
In May 2020, Super Cyclone Amphan hit the India-Bangladesh border, bringing heavy rainfall and strong winds and affecting more than 13 million citizens. The cyclone also caused storm surges of 2-4 metres, flooding coastal regions in the Bay of Bengal.
While over the ocean, this category five storm – that’s a storm’s highest possible rating – became the strongest cyclone to have formed in the Bay of Bengal since 1999, reaching wind speeds of up to 260 km/h. Although it weakened to a category two storm following landfall, it remained the strongest cyclone to hit the Ganges Delta since 2007.
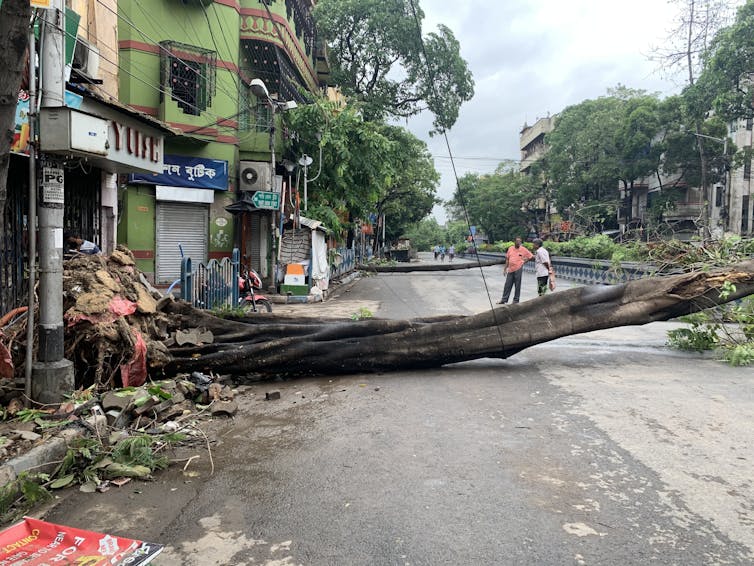
Amphan had severe consequences for people, agriculture, the local economy and the environment. It tragically resulted in more than 120 deaths, as well as damaging or destroying homes and power grids: leaving millions without electricity or communication in the midst of an ongoing pandemic.
Relief and aid efforts were hampered by flood damage to roads and bridges, as well as by coronavirus restrictions. Large areas of crops including rice, sesame and mangos were damaged, and fertile soils were either washed away or contaminated by saline sea water. Overall, Super Cyclone Amphan was the costliest event ever recorded in the North Indian Ocean, resulting in over $13 billion (£10 billion) of damage.
In a recent study led by the University of Bristol and drawing on research from Bangladesh and France, we’ve investigated how the effects of storm surges like that caused by Amphan on the populations of India and Bangladesh might change under different future climate and population scenarios.
Amphan: Mark II
Rising sea levels – thanks largely to melting glaciers and ice sheets – appear to be behind the greatest uptick in future risk from cyclone flooding, since they allow storm surges to reach further inland. It’s therefore key to understand and predict how higher sea levels might exacerbate storm-driven flooding, in order to minimise loss and damage in coastal regions.
Our research used climate models from CMIP6, the latest in a series of projects aiming to improve our understanding of climate by comparing simulations produced by different modelling groups around the world. First we modelled future sea-level rise according to different future emissions scenarios, then we added that data to storm surge estimates taken from a model of Super Cyclone Amphan.
We ran three scenarios: a low emission scenario, a business-as-usual scenario and a high emission scenario. And in addition to modelling sea-level rise, we also estimated future populations across India and Bangladesh to assess how many more people storm surges could affect. In most cases, we found that populations are likely to rise: especially in urban areas.
Our findings were clear: exposure to flooding from cyclone storm surges is extremely likely to increase. In India, exposure increase ranged from 50-90% for the lowest emission scenario, to a 250% increase for the highest emission scenario. In Bangladesh, we found a 0-20% exposure increase for the lowest emission scenario and a 60-70% increase for the highest emission scenario. The difference in exposure between the two countries is mostly due to declining coastal populations as a result of urban migration inland.
Imagine we’re now in 2100. Even in a scenario where we’ve managed to keep global emissions relatively low, the local population exposed to storm surge flooding from an event like Amphan will have jumped by ~350,000. Compare this to a high emission scenario, where an extra 1.35 million people will now be exposed to flooding. And for flood depths of over one metre – a depth that poses immediate danger to life – almost half a million more people will be exposed to storm surge flooding in a high emission scenario, compared to a low emission scenario.
.jpg)
This research provides yet more support for rapidly and permanently reducing our greenhouse gas emissions to keep global warming at 1.5°C above pre-industrial levels.
Although we’ve focused on storm surge flooding, other cyclone-related hazards are also projected to worsen, including deadly heatwaves following cyclones hitting land. And in the case of Amphan, interplay between climate change and coronavirus likely made the situation for people on the ground far worse. As the world warms, we mustn’t avoid the reality that pandemics and other climate-related crises are only forecast to increase.
Urgent action on emissions is vital to protect highly climate-vulnerable countries from the fatal effects of extreme weather. Amphan Mark II need not be as destructive as we’ve projected if the world’s governments act now to meet Paris agreement climate goals.![]()
-----------------------------
This blog is written by Cabot Institute for the Environment members Dr Laurence Hawker, Senior Research Associate in Geography, University of Bristol; Professor Dann Mitchell, Professor of Climate Science, University of Bristol, and Dr Natalie Lord, Honorary Research Associate in Climate Science, University of Bristol
This article is republished from The Conversation under a Creative Commons license. Read the original article.