
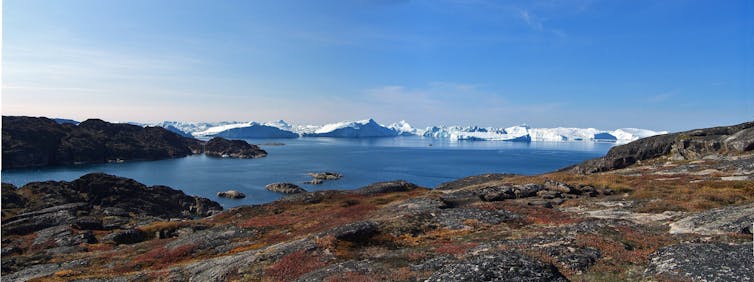
Greenland is the largest island in the world and on it rests the largest ice mass in the Northern Hemisphere. If all that ice melted, the sea would rise by more than 7 metres.
But that’s not going to happen is it? Well not any time soon, but understanding how much of the ice sheet might melt over the coming century is a critical and urgent question that scientists are trying to tackle using sophisticated numerical models of how the ice sheet interacts with the rest of the climate system. The problem is that the models aren’t that good at reproducing recent observations and are limited by our poor knowledge of the detailed topography of the subglacial terrain and fjords, which the ice flows over and in to.
One way around this problem is to see how the ice sheet responded to changes in climate in the past and compare that with model projections for the future for similar changes in temperature. That is exactly what colleagues and I did in a new study now published in the journal Nature Communications.
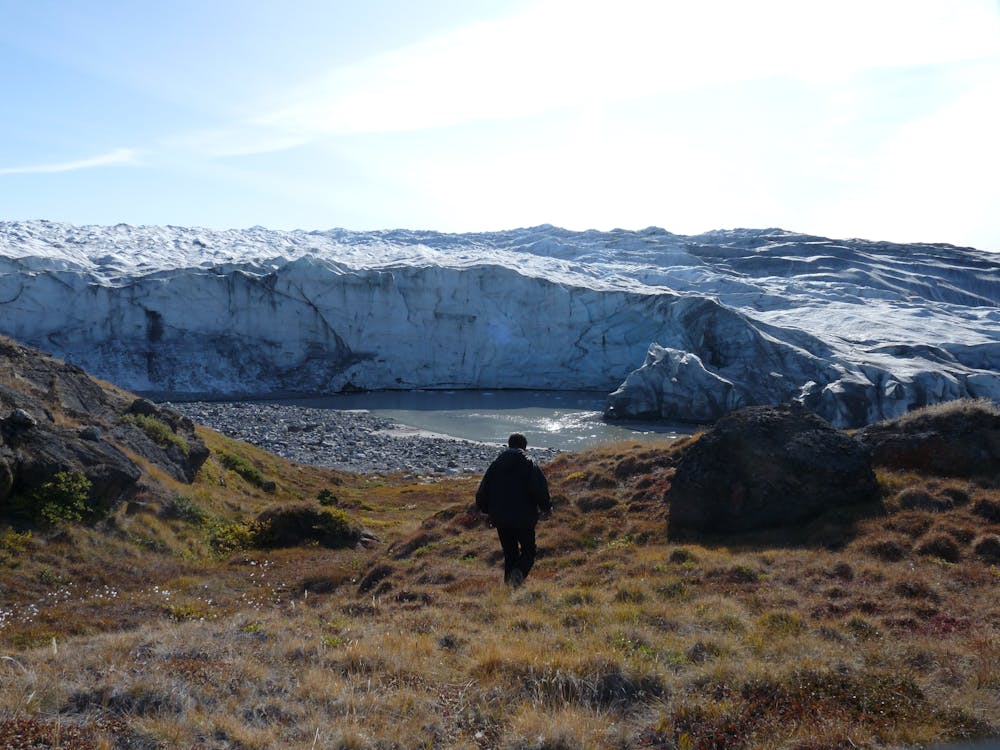
We looked at the three largest glaciers in Greenland and used historical aerial photographs combined with measurements scientists had taken directly over the years, to reconstruct how the volume of these glaciers had changed over the period 1880 to 2012. The approach is founded on the idea that the past can help inform the future, not just in science but in all aspects of life. But just like other “classes” of history, the climate and the Earth system in future won’t be a carbon copy of the past. Nonetheless, if we figure out exactly how sensitive the ice sheet has been to temperature changes over the past century, that can provide a useful guide to how it will respond over the next century.
We found that the three largest glaciers were responsible for 8.1mm of sea level rise, about 15% of the whole ice sheet’s contribution. Over the period of our study the sea globally has risen by around 20cm, about the height of an A5 booklet, and of that, about a finger’s width is entirely thanks to ice melting from those three Greenland glaciers.
Melting As Usual
So what does that tell us about the future behaviour of the ice sheet? In 2013, a modelling study by Faezeh Nick and colleagues also looked at the same “big three” glaciers (Jakobshavn Isbrae in the west of the island and Helheim and Kangerlussuaq in the east) and projected how they would respond in different future climate scenarios. The most extreme of these scenarios is called RCP8.5 and assumes that economic growth will continue unabated through the 21st century, resulting in a global mean warming of about 3.7˚C above today’s temperatures (about 4.8˚C above pre-industrial or since 1850).
This scenario has sometimes been referred to as Business As Usual (BAU) and there is an active debate among climate researchers regarding how plausible RCP8.5 is. It’s interesting to note, however, that, according to a recent study from a group of US scientists it may be the most appropriate scenario up to at least 2050. Because of something called polar amplification the Arctic will likely heat up by more than double the global average, with the climate models indicating around 8.3˚C warming over Greenland in the most extreme scenario, RCP8.5.
Despite this dramatic and terrifying hike in temperature Faezeh’s modelling study projected that the “big three” would contribute between 9 and 15 mm to sea level rise by 2100, only slightly more than what we obtained from a 1.5˚C warming over the 20th century. How can that be? Our conclusion is that the models are at fault, even including the latest and most sophisticated available which are being used to assess how the whole ice sheet will respond to the next century of climate change. These models appear to have a relatively weak link between climate change and ice melt, when our results suggest it is much stronger. Projections based on these models are therefore likely to under-predict how much the ice sheet will be affected. Other lines of evidence support this conclusion.
What does all of that mean? If we do continue along that very scary RCP8.5 trajectory of increasing greenhouse gas emissions, the Greenland ice sheet is very likely to start melting at rates that we haven’t seen for at least 130,000 years, with dire consequences for sea level and the many millions of people who live in low lying coastal zones.![]()
--------------------------
This blog is written by Cabot Institute member Jonathan Bamber, Professor of Physical Geography, University of Bristol. This article is republished from The Conversation under a Creative Commons license. Read the original article.
 |
| Professor Jonathan Bamber |