
Fracking – hailed by some as the greatest recent advance in energy production, criticised by others for the threat it poses to local life – continues to divide opinion.
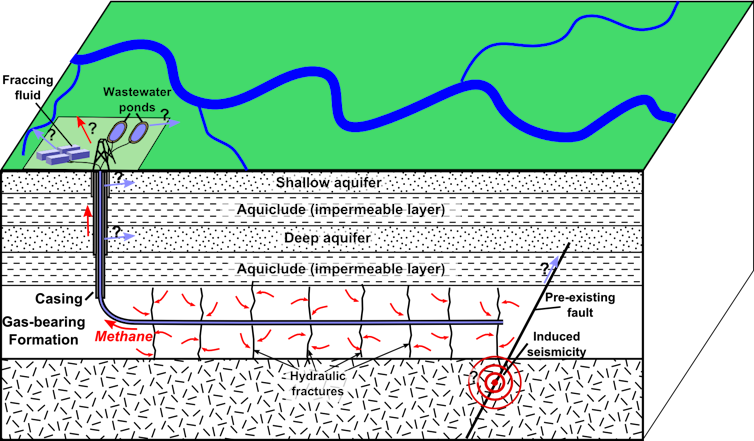
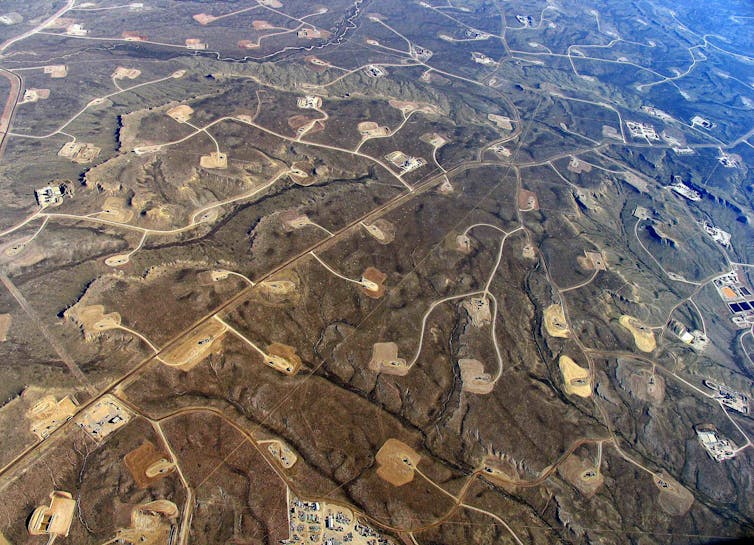
The term fracking refers to the high-pressure injection of water mixed with fluid chemical additives – including friction reducers, gels and acids – and “propping agents” such as sand to create fractures in deep rock formations such as shale, allowing oil or gas to flow out.
Tens of thousands of hydraulic fracturing wells have been drilled across the US, generating huge benefits for its energy industry and economy: yet the practice remains globally controversial. It is not permitted in numerous other countries, such as France, Germany, Ireland and, since 2019, the UK.
While some see fracking as the most important change in the energy sector since the introduction of nuclear energy more than 50 years ago, others raise health and environmental concerns: in particular, the threat fracking could pose to our water.
Starting in 2010, many US states began to regulate fracking, obliging operators to disclose the substances used in their fluid mix. As economists, we were curious to see whether mandatory disclosures of what’s in fracturing fluids made the practice cleaner, or reduced potential water contamination.
To do that, we needed to compare the environmental impact from fracking before and after the new disclosure rules. We assembled a database that put together existing measurements of surface water quality with the location of fracking wells, and analysed changes in surface water quality around new wells over an 11-year period.
We noticed some strong associations, but also discovered that these associations had not been previously documented. Deciding to study the link between new hydraulic fracturing wells and surface water quality, we were able to provide evidence for a relationship between the two.
The link
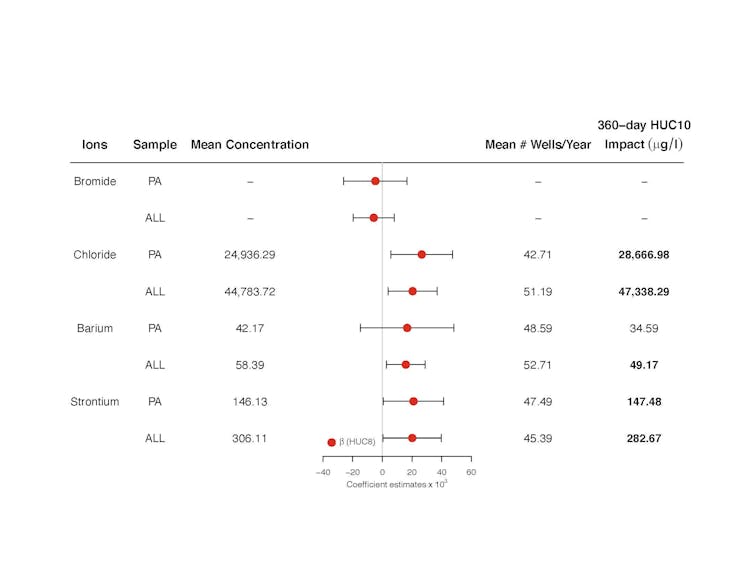
Our study, published in Science, uses a statistical approach to identify changes in the concentration of certain salts associated with new wells. We discovered a very small but consistent increase in barium, chloride and strontium – for bromide, our results were more mixed and not as robust.
Salt concentrations were most increased at monitoring stations that were located within 15 km and downstream from a well, and in measurements taken within a year of fracking activity.
The increases in salt we discovered were small and within the bounds of what the US Environmental Protection Agency considers safe for drinking water. However, since our water measurements were mostly taken from rivers, not all of the public surface water monitors we used are close to wells, or are in locations where they can detect the effects of fracking: for example, they may be located upstream of new wells. That means the salt concentrations in water flowing downstream from new wells could be even higher.
Our study was also limited by the public data available. We were not able to investigate potentially more toxic substances found in the fracturing fluids or in the produced water, such as radium or arsenic. Public databases do not widely include measurements of these other substances, making it hard for researchers to carry out the statistical analysis needed to detect anomalous concentrations related to new wells.
That said, the salts we analysed are not exactly innocuous. High concentrations of barium in drinking water may lead to increases in blood pressure, while chloride can potentially threaten aquatic life. Elevated strontium levels can even have adverse impacts on human bone development, especially in the young.
Next steps
It is undeniable that fracking has played a big role in replacing the fossil fuel coal as a source of energy. Some studies show that, relative to periods of massive coal-burning, the overall quality of surface water has improved. Fracking has also brought an economic boost to underdeveloped areas. Still, the question remains as to whether it is safe for local communities.
While our study is an important step towards understanding the environmental impact of fracking, more data are needed to truly answer these safety concerns. The good news is, with new disclosure rules, we have a better awareness of exactly which chemicals are being used.
The next step is for policymakers to make sure that government agencies systematically track these chemical in fracking fluids and produced waters, place monitoring stations in locations where they can better track surface water impacts, and increase the frequency of water quality measurement around the time new wells are drilled.
A more targeted approach could go a long way in enabling research and helping to protect the public health of communities for whom fracking could yet be a blessing or a curse.
---------------------------![]()
This blog is written by Giovanna Michelon, Professor of Accounting, University of Bristol; Christian Leuz, Professor of International Economics, Finance and Accounting, University of Chicago, and Pietro Bonetti, Assistant Professor of Accounting and Control, IESE Business School (Universidad de Navarra)
This article is republished from The Conversation under a Creative Commons license. Read the original article.
