
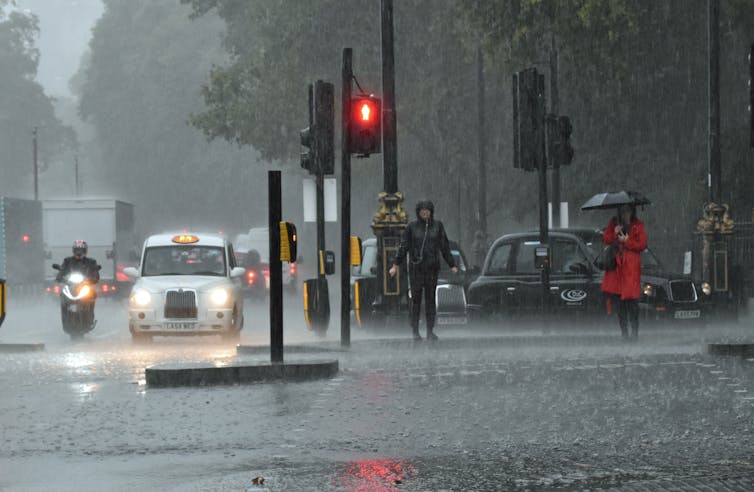
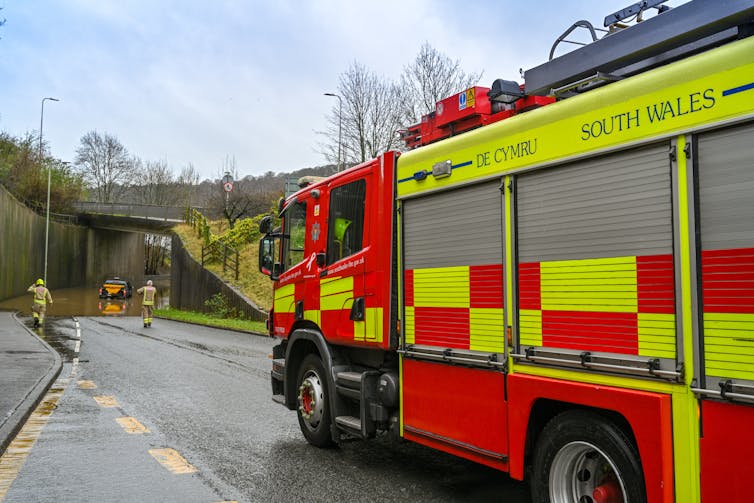
In July 2021, Kew in London experienced a month’s rain in just three hours. Across the city, tube lines were suspended and stations closed as London experienced its wettest day in decades and flash floods broke out. Just under two weeks later, it happened again: intense downpours led to widespread disruption, including the flooding of two London hospitals.
Colleagues and I have created a new set of 100-year climate projections to more accurately assess the likelihood of heavy rain downpours like these over the coming years and decades. The short answer is climate change means these extreme downpours will happen more often in the UK – and be even more intense.
To generate these projections, we used the Met Office operational weather forecast model, but run on long climate timescales. This provided very detailed climate projections – for every 2.2km grid box over the UK, for every hour, for 100 years from 1981 to 2080. These are much more detailed than traditional climate projections and needed to be run as a series of 20-year simulations that were then stitched together. Even on the Met Office supercomputer, these still took about six months to run.
We ran 12 such 100-year projections. We are not interested in the weather on a given day but rather how the occurrence of local weather extremes varies year by year. By starting the model runs in the past, it is also possible to verify the output against observations to assess the model’s performance.
At this level of detail – the “k-scale” – it is possible to more accurately assess how the most extreme downpours will change. This is because k-scale simulations better represent the small-scale atmospheric processes, such as convection, that can lead to destructive flash flooding.
More emissions, more rain
Our results are now published in Nature Communications. We found that under a high emissions scenario downpours in the UK exceeding 20mm per hour could be four times as frequent by the year 2080 compared with the 1980s. This level of rainfall can potentially produce serious damage through flash flooding, with thresholds like 20mm/hr used by planners to estimate the risk of flooding when water overwhelms the usual drainage channels. Previous less detailed climate models project a much lower increase of around two and a half times over the same period.
We note that these changes are assuming that greenhouse gas emissions continue to rise at current rates. This is therefore a plausible but upper estimate. If global carbon emissions follow a lower emissions scenario, extreme rain will still increase in the UK – though at a slower rate. However, the changes are not inevitable, and if we emit less carbon in the coming decades, extreme downpours will be less frequent.
The increases are significantly greater in certain regions. For example, extreme rainfall in north-west Scotland could be almost ten times more common, while it’s closer to three times more frequent in the south of the UK. The greater future increases in the number of extreme rainfall events in the higher resolution model compared with more traditional lower resolution climate models shows the importance of having k-scale projections to enable society to adapt to climate change.
As the atmosphere warms, it can hold more moisture, at a rate of 7% more moisture for every degree of warming. On a simple level, this explains why in many regions of the world projections show an increase in precipitation as a consequence of human-induced climate change. This new study has shown that, in the UK, the intensity of downpours could increase by about 5% in the south and up to about 15% in the north for every degree of regional warming.
However, it is far from a simple picture of more extreme events, decade by decade, as a steadily increasing trend. Instead, we expect periods of rapid change – with records being broken, some by a considerable margin – and periods when there is a pause, with no new records set.
This is simply a reflection of the complex interplay between natural variability and the underlying climate change signal. An analogy for this is waves coming up a beach on an incoming tide. The tide is the long-term rising trend, but there are periods when there are larger waves, followed by lulls.
Despite the underlying trend, the time between record-breaking events at the local scale can be surprisingly long – even several decades.
Our research marks the first time that such a high-resolution data set has spanned over a century. As well as being a valuable asset for planners and policymakers to prepare for the future, it can also be used by climate attribution scientists to examine current extreme rainfall events to see how much more likely they will have been because of human greenhouse gas emissions. The research highlights the importance of meeting carbon emissions targets and also planning for increasingly prevalent extreme rainfall events, which to varying degrees of intensity, look highly likely in all greenhouse gas emissions scenarios.
The tendency for extreme years to cluster poses challenges for communities trying to adapt to intense downpours and risks infrastructure being unprepared, since climate information based on several decades of past observations may not be representative of the following decades.
------------------------
This blog is written by Cabot Institute for the Environment member Elizabeth Kendon, Professor of Climate Science, University of Bristol. This article is republished from The Conversation under a Creative Commons license. Read the original article.
 |
| Professor Lizzie Kendon |