
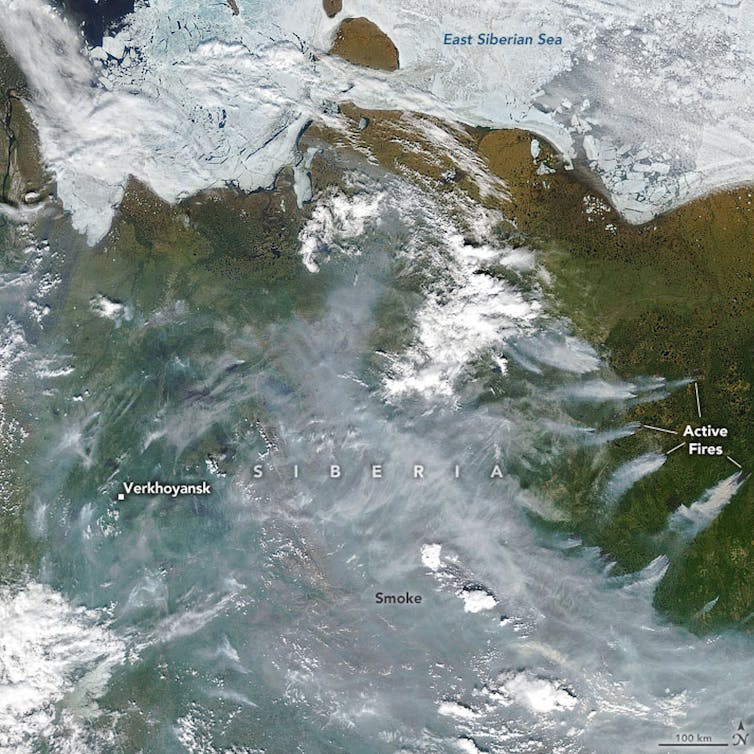
On the eve of the summer solstice, something very worrying happened in the Arctic Circle. For the first time in recorded history, temperatures reached 38°C (101°F) in a remote Siberian town – 18°C warmer than the maximum daily average for June in this part of the world, and the all-time temperature record for the region.
New records are being set every year, and not just for maximum temperatures, but for melting ice and wildfires too. That’s because air temperatures across the Arctic have been increasing at a rate that is about twice the global average.
All that heat has consequences. Siberia’s recent heatwave, and high summer temperatures in previous years, have been accelerating the melting of Arctic permafrost. This is the permanently frozen ground which has a thin surface layer that melts and refreezes each year. As temperatures rise, the surface layer gets deeper and structures embedded in it start to fail as the ground beneath them expands and contracts. This is what is partly to blame for the catastrophic oil spill that occurred in Siberia in June 2020, when a fuel reservoir collapsed and released more than 21,000 tonnes of fuel – the largest ever spill in the Arctic.
So what is wrong with the Arctic, and why does climate change here seem so much more severe compared to the rest of the world?
The warming models predicted
Scientists have developed models of the global climate system, called general circulation models, or GCMs for short, that reproduce the major patterns seen in weather observations. This helps us track and predict the behaviour of climate phenomena such as the Indian monsoon, El Niño, Southern Oscillations and ocean circulation such as the gulf stream.GCMs have been used to project changes to the climate in a world with more atmospheric CO₂ since the 1990s. A common feature of these models is an effect called polar amplification. This is where warming is intensified in the polar regions and especially in the Arctic. The amplification can be between two and two and a half, meaning that for every degree of global warming, the Arctic will see double or more. This is a robust feature of our climate models, but why does it happen?
Fresh snow is the brightest natural surface on the planet. It has an albedo of about 0.85, which means that 85% of solar radiation falling on it is reflected back out to space. The ocean is the opposite – it’s the darkest natural surface on the planet and reflects just 10% of radiation (it has an albedo of 0.1). In winter, the Arctic Ocean, which covers the North Pole, is covered in sea ice and that sea ice has an insulating layer of snow on it. It’s like a huge, bright thermal blanket protecting the dark ocean underneath. As temperatures rise in spring, sea ice melts, exposing the dark ocean underneath, which absorbs even more solar radiation, increasing warming of the region, which melts even more ice. This is a positive feedback loop which is often referred to as the ice-albedo feedback mechanism.
This ice-albedo (really snow-albedo) feedback is particular potent in the Arctic because the Arctic Ocean is almost landlocked by Eurasia and North America, and it’s less easy (compared to the Antarctic) for ocean currents to move the sea ice around and out of the region. As a result, sea ice that stays in the Arctic for longer than a year has been declining at a rate of about 13% per decade since satellite records began in the late 1970s.
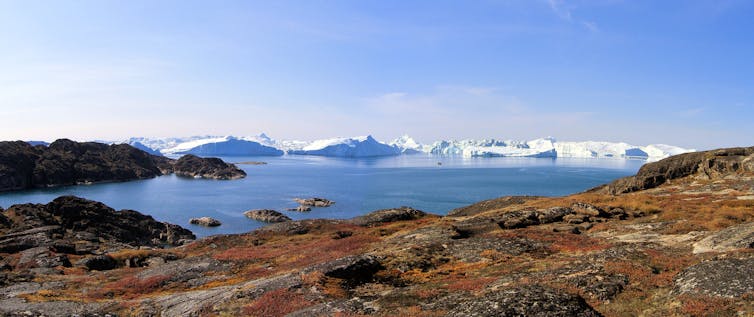
In fact, there is evidence to indicate that sea ice extent has not been this low for at least the last 1,500 years. Extreme melt events over the Greenland Ice Sheet, that used to occur once in every 150 years, have been seen in 2012 and now 2019. Ice core data shows that the enhanced surface melting on the ice sheet over the past decade is unprecedented over the past three and a half centuries and potentially over the past 7,000 years.
In other words, the record-breaking temperatures seen this summer in the Arctic are not a “one-off”. They are part of a long-term trend that was predicted by climate models decades ago. Today, we’re seeing the results, with permafrost thaw and sea ice and ice sheet melting. The Arctic has sometimes been described as the canary in the coal mine for climate breakdown. Well it’s singing pretty loudly right now and it will get louder and louder in years to come.
-------------------------------
This blog is written by Cabot Institute member Jonathan Bamber, Professor of Physical Geography, University of Bristol. This article is republished from The Conversation under a Creative Commons license. Read the original article.
 |
| Professor Jonathan Bamber |