

Arctic sea ice plays a crucial role in the Earth’s energy balance. It is covered for most of the year by snow, which is the brightest natural surface on the planet, reflecting about 80% of the solar radiation that hits it back out to space.
Meanwhile, the ocean it floats on is the darkest natural surface on the planet, absorbing 90% of incident solar radiation. For that reason, changes in sea ice cover have a big impact on how much sunlight the planet absorbs, and how fast it warms up.
Each year a thin layer of the Arctic Ocean freezes over, forming sea ice. In spring and summer this melts back again, but some of the sea ice survives through the summer and is known as multi-year ice. It’s thicker and more resilient than the sea ice that forms and melts each year, but as the Arctic climate warms – at a rate more than twice that of the rest of the world – this multi-year ice is under threat.
In the last 40 years, multi-year ice has shrunk by about half. At some time in the next few decades, scientists expect the world will see an ice-free Arctic Ocean throughout the summer, with worrying consequences for the rest of the climate system. That prospect got much closer in 2020, due in part to the exceptional summer heatwave that roiled the Russian Arctic.
Shutting down the sea ice factory
The oceans have a large thermal capacity, which means they can store huge amounts of heat. In fact, the top metre of the oceans has about the same thermal capacity as the whole of the atmosphere. Many of us have experienced a balmy afternoon in autumn by the coast even though the air temperature inland is only a few degrees above freezing. That’s because the oceans accumulate heat slowly over the summer, releasing it equally slowly during winter.
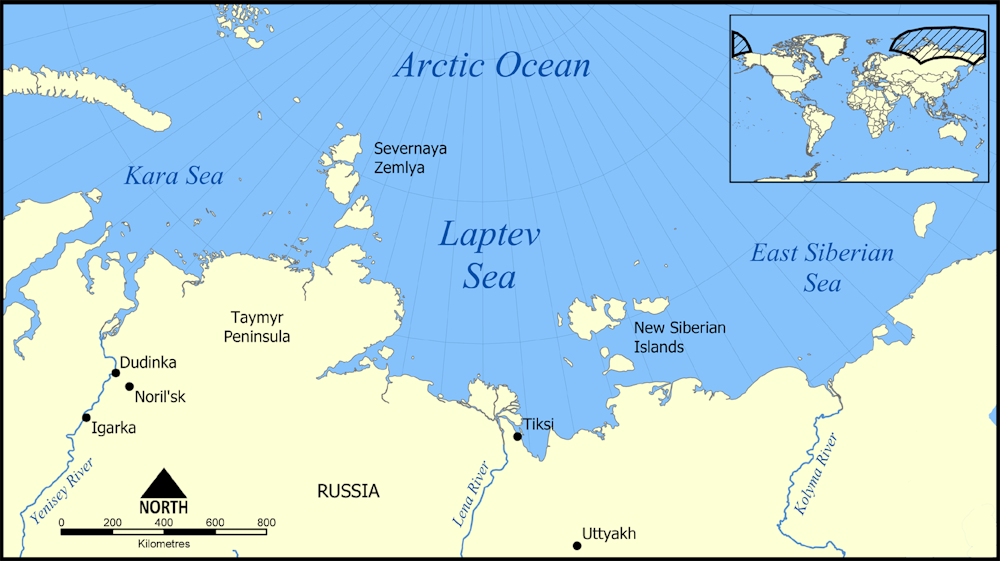
So it is with the Laptev Sea, lying north of the Siberian coast. This part of the Arctic Ocean is usually a factory for new sea ice in autumn and winter as air temperatures dip below zero and surface water starts to freeze. That new ice is carried westward by persistent offshore winds in a kind of conveyor belt.
This process is powered by the formation of polynyas: areas of open water surrounded by sea ice. Polynas act as engines of new sea ice production by exchanging heat with the colder atmosphere, causing the water to freeze. But if there is no sea ice to start with, the polynya cannot form and the whole process shuts down.
Sea ice in the Laptev Sea reached a record low in 2020, with no new ice through October, later than any previous year in the satellite record. The exceptional summer heatwave across Siberia will have resulted in heat accumulating in the adjacent ocean, which is now delaying the regrowth of sea ice.
Laptev Sea (#Arctic) ice watch ---> 😅 pic.twitter.com/O0q6M74Xs4
— Zack Labe (@ZLabe) October 14, 2020
In the 1980s, there was as much as 600,000 square kilometres of multi-year ice covering around two thirds of the Laptev Sea. In 2020, it has been ice-free for months with no multi-year ice left at all. The whole Arctic Ocean is heading for ice-free conditions in the future, defined as less than one million square kilometres of ice cover. That’s down from about 8 million square kilometres just 40 years ago. This year’s new record delay in ice formation in the Laptev Sea takes it a step closer.
A rapidly changing Arctic is a global cause for concern. Thawing permafrost releases methane, a greenhouse gas that is about 84 times more potent than CO₂ when measured over 20 years.
Meanwhile, the Greenland Ice Sheet, the largest ice mass in the northern hemisphere, is currently contributing more to sea levels rising than any other source, and has enough ice in it to raise global sea level by 7.4 metres. And if the machinations of a warming Arctic still seem remote, evidence suggests that even the weather across much of the northern hemisphere is heavily influenced by what happens in the rapidly changing roof of the world.![]()
-------------------------------------
This blog is written by Cabot Institute member Jonathan Bamber, Professor of Physical Geography, University of Bristol. This article is republished from The Conversation under a Creative Commons license. Read the original article.

Jonathan Bamber
Read more from Professor Jonathan Bamber: Siberia heatwave: why the Arctic is warming so much faster than the rest of the world