One of the challenges of the 21st century is how to reconcile global urban growth with the prevention and mitigation of environmental disasters, such as those caused by landslides. Every year 300 million people are exposed to landslides worldwide, with over 4,000 fatalities, 250,000 of people affected, and billions of US dollars of economic damage. However, impacts might be worse in the future for two main reasons. First, severe precipitations might become more frequent under climate change, causing more rainfall-triggered landslides. Second, growing urban population will lead more people to live in areas exposed to landslides globally, and in particular in developing countries where low-income dwellers are starting to overcrowd landslide-prone areas such as steep slopes. With more hurricanes to come and more people at risk, understanding where and when landslides might occur is becoming increasingly crucial.
Current predictions are too uncertain to support decisions
One method to predict landslides in the future is to look at landslides in the past. The analysis of historical records allows the identification of those hillslopes that have failed in the past. Currently stable hillslopes where similar conditions exist (for example, similar slope gradients) are ‘tagged’ with high landslide probability. These areas might be then excluded for construction development or might be the first to be alerted when a severe precipitation is expected.
This approach to landslide prediction is, however, often insufficient. Landslides and rainfall records as well as data on hillslope properties are often affected by large errors or unavailable in sufficient detail. In addition, what happened in the past might not be representative of what may happen in the future, making historical records less useful for long-term projections. Climate and socio-economic models can be used to build scenarios of how rainfall patters and cities might look like in the future. Unfortunately, these scenarios can vary significantly because they depend on highly uncertain factors such as future carbon emissions. As a result, landslide estimates can also be very different and sometimes even contradictory - some predicting an increase and others a decrease in landslides occurrence - undermining their practical use for risk management.
From 'predict then act' to 'act now with low regrets'
Instead of trying to predict how climate and urban expansion will evolve in the future, I used a different approach centred on decision making. I ask the question: how much climate and/or urban expansion needs to change before landslide hazard significantly increases?
The scientific method behind my analysis (Bozzolan et al. 2020, NHESS) first generates thousands of synthetic but realistic hillslopes representations of the study area. Then, it imposes hypothetical scenarios of increasing rainfall severities and urban expansion, also considering different construction features that could affect slope stability (for example, the presence or not of adequate slope drainage such as roof gutters on houses).
Finally, it uses a computer model to assess the stability of these virtual hillslopes, generating a new synthetic library of landslide records. By exploring the library is now possible to identify those combinations of rainfall and urban development conditions (e.g., with or without roof gutters) for which hillslopes are most likely to fail. ‘Low-regret’ mitigation actions will be those that perform well across scenarios and therefore should be prioritised even if future rainfall and urban predictions remain unknown.
A practical tool for decision makers
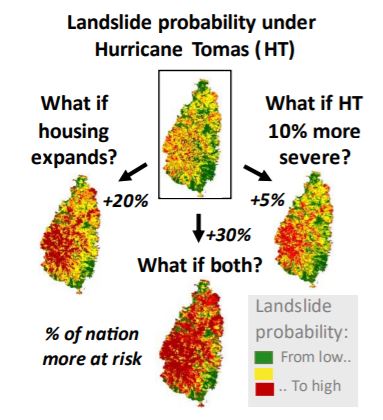
This new method which explores many ‘what if’ scenarios is a useful tool for decision makers in landslide risk management and reduction. For example, figure 1 shows how a map of landslide probability in Saint Lucia (Eastern Caribbean) might look like if the severity of a destructive rainstorm such as the 2010 Hurricane Tomas were to increase under climate change or if unregulated housing expanded on slopes susceptible to failure. The analysis also shows that when both scenarios are included landslide probability disproportionally increases, revealing that ‘the whole is greater than the sum of its parts’. This information could be used to assess the risk and damages associated with each scenario and to identify low-regret nation-wide risk reduction and risk transfer strategies.
 | ||
| Figure 1: Maps of landslide probability in Saint Lucia under different ‘what if’ scenarios. The percentage (+%) indicates the increase of areas with high landslide probability. |
The same method can also be applied to quantify the cost-benefit ratio of different landslide mitigation options, such as improving urban drainage or tree planting at the community/household scale. In Freetown (Sierra Leone), for example, I collaborated with the engineering firm Arup to identify those landslide hazard mitigation actions that would lead to the largest reduction in landslide probability for certain locations or types of slopes, and should thus be prioritised. The information generated through this analysis not only provides evidence to governments and investors for informing urban planning, but it might also encourage landslide probability from low to high micro-insurance in disaster prevention, where insurers offer lower premiums to reward risk-reducing behaviours.
-----------------------------
This blog is written by Cabot Institute for the Environment member, Dr Elisa Bozzolan from the School of Civil Engineering at the University of Bristol.
