
Warming up the poles: how past climates assist our understanding of future climate

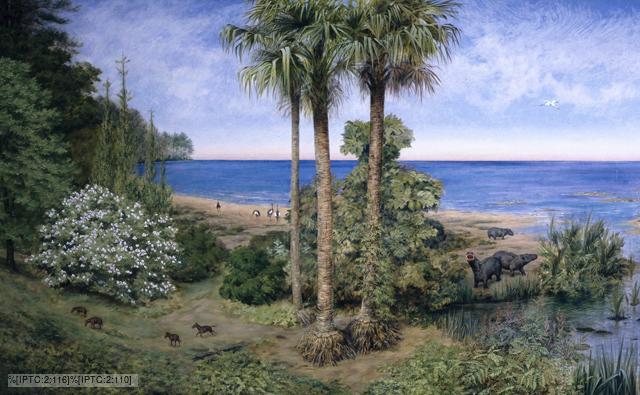
Eocene, by Natural History Museum London
The early Eocene epoch (56 to 48 million years ago), is thought to be the warmest period on Earth in the past 65 million years. Geological evidence from this epoch indicates that the polar regions were very warm, with mean annual sea surface temperatures of > 25°C measured from geological proxies and evidence of a wide variety of vegetation including palm trees and insect pollinated plants found on land. Unfortunately, geological data from the tropics is limited for the early Eocene, although the data that does exist indicates temperatures only slightly warmer than the modern tropics, which are ~28°C.  The reduced temperature difference between the tropics and the poles in the early Eocene and the implied global warmth has resulted in the label of an ‘equable’ climate.

Simulating the early Eocene equable climate with climate models, however, has not been straightforward. There have been remarkable model-data differences with simulated polar temperatures are too cool and / or tropical temperatures that are too hot; or the CO2 concentrations used for a reasonable model-data match being outside the range of those measured for the early Eocene.

There are uncertainties in both geological evidence and climate models, and whilst trying to resolve the early Eocene equable climate problem has resulted in an improved understanding of geological data, there are uncertain aspects of climate models that still need to be examined.  Climate processes for which knowledge is limited or measurements are difficult, such as clouds, or which have a small spatial and temporal range are often simplified in climate models or parameterised. These uncertain model parameters are then tuned to best-match the modern observational climate record. This approach is not ideal, but it is sometimes necessary and it has been shown that the modern values of some parameters, such as atmospheric aerosols, may not be representative of past climates such as the early Eocene, with their removal improved the model-data match.

However, a climate model that can simulate both the present day climate and past more extreme climates without significant modification potentially offers a more robust method of understanding modern and future climate processes in a warming world. We have conducted research in which uncertain climate parameters are varied within their modern upper and lower boundaries in order to examine whether any of these combinations is capable of the above. And we have found one simulation, E17, from a total of 115, which simulates the early Eocene equable climate and improves the model-data match whilst also simulating the modern climate and a past cold climate, the last Glacial Maximum reasonably well.

This work hopefully highlights how paleoclimate modelling is a valuable tool in understanding natural climate variability and how paleoclimates can provide a test bed for climate models, which are used to predict future climate change.

This blog has been written by Nav Sagoo, Geographical Sciences, University of Bristol.
Nav Sagoo, University of Bristol

Popular posts from this blog

Converting probabilities between time-intervals

This is the first in an irregular sequence of snippets about some of the slightly more technical aspects of uncertainty and risk assessment.  If you have a slightly more technical question, then please email me and I will try to answer it with a snippet. Suppose that an event has a probability of 0.015 (or 1.5%) of happening at least once in the next five years. Then the probability of the event happening at least once in the next year is 0.015 / 5 = 0.003 (or 0.3%), and the probability of it happening at least once in the next 20 years is 0.015 * 4 = 0.06 (or 6%). Here is the rule for scaling probabilities to different time intervals: if both probabilities (the original one and the new one) are no larger than 0.1 (or 10%), then simply multiply the original probability by the ratio of the new time-interval to the original time-interval, to find the new probability. This rule is an approximation which breaks down if either of the probabilities is greater than 0.1. For example

1-in-200 year events

You often read or hear references to the ‘1-in-200 year event’, or ‘200-year event’, or ‘event with a return period of 200 years’. Other popular horizons are 1-in-30 years and 1-in-10,000 years. This term applies to hazards which can occur over a range of magnitudes, like volcanic eruptions, earthquakes, tsunamis, space weather, and various hydro-meteorological hazards like floods, storms, hot or cold spells, and droughts. ‘1-in-200 years’ refers to a particular magnitude. In floods this might be represented as a contour on a map, showing an area that is inundated. If this contour is labelled as ‘1-in-200 years’ this means that the current rate of floods at least as large as this is 1/200 /yr, or 0.005 /yr. So if your house is inside the contour, there is currently a 0.005 (0.5%) chance of being flooded in the next year, and a 0.025 (2.5%) chance of being flooded in the next five years. The general definition is this: ‘1-in-200 year magnitude is x’ = ‘the current rate for eve

Coconuts and climate change

Before pursuing an MSc in Climate Change Science and Policy at the University of Bristol, I completed my undergraduate studies in Environmental Science at the University of Colombo, Sri Lanka. During my final year I carried out a research project that explored the impact of extreme weather events on coconut productivity across the three climatic zones of Sri Lanka. A few months ago, I managed to get a paper published and I thought it would be a good idea to share my findings on this platform. Climate change and crop productivity  There has been a growing concern about the impact of extreme weather events on crop production across the globe, Sri Lanka being no exception. Coconut is becoming a rare commodity in the country, due to several reasons including the changing climate. The price hike in coconuts over the last few years is a good indication of how climate change is affecting coconut productivity across the country. Most coconut trees are no longer bearing fruits and thos