
AGU 2013: The importance of 400 ppm CO2

AGU 2013
On 1 June 2012, a concentration of 400 ppm carbon dioxide was measured in air samples in the Arctic.  On 9 May 2013, Mauna Loa, the longest recording station, measured a daily average of 400 ppm carbon dioxide. Next year we may see the global average concentration reach 400 ppm and the year after that 400 ppm could be measured at the South Pole. The 400 ppm number is arbitrary, but it is a symbol of the anthropogenic climate change that scientists have been talking about for many years.

Here at the University of Bristol, the upcoming 400 ppm epoch prompted the question of what do we know about 400 ppm CO2 climates and how  could it be used to galvanize action on climate change?  But 400 ppm and climate change is a bigger issue than one University can take on, so we took our idea to the American Geosciences Union Fall conference.  With more than 24,000 attendees each year, AGU is the perfect place to talk about what 400 ppm CO2 means in a scientific sense and what we as scientists should do about communicating it.

Two sessions were proposed: one looking at the science of 400 ppm CO2 climates, co-convened with Kerim Nisanciouglu of the University of Bergen, Norway, the other at communicating 400 ppm co-convened with Kent Peacock of University of Lethbridge and Casey Brown of UMass Amherst.

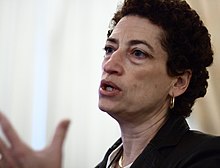
Naomi Oreskes (pictured) asked why scientists
don't allow themselves to sound alarmed when reporting alarming conclusions from their
research.
The communication session looked at how climate science could be communicated effectively.  First to speak was Naomi Oreskes, who asked why scientists don’t allow ourselves to sound alarmed when we’re reporting alarming conclusions. Citing from neuroscience research, Oreskes argued that when scientists conform to the ‘unemotional scientist’ paradigm they actually risk being less rational and sounding inauthentic.  It was clear that Oreskes’ points struck the audience, as many of them queued up to ask questions.

Myles Allen made a compelling case for sequestered adequate fraction of extracted (SAFE) carbon – i.e. compulsory carbon capture and storage. Allen pointed out that people will always pay to burn carbon and argued that a carbon price is just a way to ‘cook the planet slower’.  Robert Lempert took a less controversial stand and explained how uncertainty can be managed in robust decision making.  Using hydrological examples, Lempert suggested that by starting with the desired outcome and working backwards, uncertainty can be dealt with.  The session finished with James Hansen, talking about the right message, and how the things that people care about needs to be communicated by the best communicators.  Criticising the pursuit of unconventional fossil fuels, Hansen argued the need for a carbon tax which was redistributed back to people.  A lively question and answer session followed, with all the speakers engaging in a strong discussion and the audience contributing pointed questions. No problems with talking without emotion in this session!

The 400 ppm physical science session started by focussing on what information we could draw from climates in the past where CO2 is believed to have been ~400 ppm. The first speaker was Alan Haywood who summarised the work of the PlioMIP project which tries to understand the climate of the Pliocene (~3 million years ago) – what it was like and why.  The Pliocene is the most recent time period in the past when atmospheric CO2 concentrations could have been as high as they are today.  Two more Pliocene presentations followed.  First, Natalie Burls (standing in for Chris Brierley) explained that even with CO2 set to 400 ppm in their climate model simulations they could not match the warm temperatures reconstructed by Pliocene data – suggesting that either the climate models are not sensitive enough to CO2 or that there are other dynamical processes that we do not fully understand yet.  Thomas Chalk gave a comparison between different methods for reconstructing CO2 in the past, and concluded that the Pliocene concentration was indeed at around 400 ppm. The final talk in the palaeoclimate part of the session was given by Dana Royer who presented the most compelling evidence for very different climates in the past with polar forests at 80°N indicating annual mean temperatures in the Arctic that were 30°C warmer than they are today!  Dana presented new CO2 reconstructions demonstrating that the CO2 concentration at the time of the polar forests could have been around 400 ppm, again suggesting that our climate models may not be sensitive enough to CO2.

The next part of the session looked at current CO2 levels with a presentation by Steven Davis about the amount of CO2 that we have already committed to putting into the atmosphere. The energy infrastructure that we have already built amounts to future CO2 emissions of 318Gt, and new global commitments are still increasing. Vaughan Pratt followed with a talk about the reasons for the recent pause in the global warming trend, separating out natural causes and anthropogenic causes using mathematical and statistical analyses. He concludes that the recent pause is of natural origin.

The final part of the session peered through the looking glass into the future.  Andrew Friedman investigates the causes of the temperature asymmetry between the northern hemisphere and the southern hemisphere and how that asymmetry may alter under the future climate emission scenarios.  He concluded that the asymmetry is set to increase into the next century, with the northern hemisphere warming faster than the southern hemisphere and projects that the tropical rainbelt will shift northwards as a result.

Kirsten Zickfield has found that warming in the next
millenium might amount to 1 degree globally,
concentrated at the Poles.  Sea levels are projected to
rise by 0.8m.
The final talk of the session was given by Kirsten Zickfeld who examined the climate changes we might already be committed to as a result of the CO2 emissions we have already released (under the assumption that atmospheric CO2 stays at 400 ppm). She used a climate model with biogeochemical components to identify how long it would take for the climate to reach equilibrium with the present CO2 concentration of 400 ppm, what the climatic impacts of that equilibrium might be and whether it might be possible to return to CO2 levels below 400 ppm on human timescales by using negative emissions (carbon capture/storage schemes). She found that the already committed warming into the next millennium might amount to 1°C globally, concentrated at the poles. Sea levels are projected to rise by 0.8m due to thermal expansion alone and further increases of 10m due to ice melt are possible over much longer timescales. Committed changes for the ‘other CO2 problem’ - ocean acidification - are relatively small, with a pH drop of only 0.01 projected. She concludes that even if CO2 levels could drop below 400 ppm in the future, whilst air temperatures may stabilise, sea level may continue to rise due to thermal expansion alone.

Both of the sessions were recorded for access after the event and provoked a lot of debate, during the sessions and online.  We hope that in some small way these sessions have helped scientists think differently about what 400 ppm means and what we can do about it.

This blog was written by T Davies-Barnard and Catherine Bradshaw, Geographical Sciences, University of Bristol.
T Davies-Barnard
Catherine Bradshaw

Popular posts from this blog

Converting probabilities between time-intervals

This is the first in an irregular sequence of snippets about some of the slightly more technical aspects of uncertainty and risk assessment.  If you have a slightly more technical question, then please email me and I will try to answer it with a snippet. Suppose that an event has a probability of 0.015 (or 1.5%) of happening at least once in the next five years. Then the probability of the event happening at least once in the next year is 0.015 / 5 = 0.003 (or 0.3%), and the probability of it happening at least once in the next 20 years is 0.015 * 4 = 0.06 (or 6%). Here is the rule for scaling probabilities to different time intervals: if both probabilities (the original one and the new one) are no larger than 0.1 (or 10%), then simply multiply the original probability by the ratio of the new time-interval to the original time-interval, to find the new probability. This rule is an approximation which breaks down if either of the probabilities is greater than 0.1. For example

1-in-200 year events

You often read or hear references to the ‘1-in-200 year event’, or ‘200-year event’, or ‘event with a return period of 200 years’. Other popular horizons are 1-in-30 years and 1-in-10,000 years. This term applies to hazards which can occur over a range of magnitudes, like volcanic eruptions, earthquakes, tsunamis, space weather, and various hydro-meteorological hazards like floods, storms, hot or cold spells, and droughts. ‘1-in-200 years’ refers to a particular magnitude. In floods this might be represented as a contour on a map, showing an area that is inundated. If this contour is labelled as ‘1-in-200 years’ this means that the current rate of floods at least as large as this is 1/200 /yr, or 0.005 /yr. So if your house is inside the contour, there is currently a 0.005 (0.5%) chance of being flooded in the next year, and a 0.025 (2.5%) chance of being flooded in the next five years. The general definition is this: ‘1-in-200 year magnitude is x’ = ‘the current rate for eve

Coconuts and climate change

Before pursuing an MSc in Climate Change Science and Policy at the University of Bristol, I completed my undergraduate studies in Environmental Science at the University of Colombo, Sri Lanka. During my final year I carried out a research project that explored the impact of extreme weather events on coconut productivity across the three climatic zones of Sri Lanka. A few months ago, I managed to get a paper published and I thought it would be a good idea to share my findings on this platform. Climate change and crop productivity  There has been a growing concern about the impact of extreme weather events on crop production across the globe, Sri Lanka being no exception. Coconut is becoming a rare commodity in the country, due to several reasons including the changing climate. The price hike in coconuts over the last few years is a good indication of how climate change is affecting coconut productivity across the country. Most coconut trees are no longer bearing fruits and thos