
Taking a trip to the cassava field!

At the end of last week I was lucky enough to be invited on a trip to the field. I didn’t really know what to expect but was very excited to find out!

The purpose of the trip was to collect data for the 5CP project to find out how different varieties of cassava respond to Cassava brown streak disease (CBSD) and Cassava mosaic disease (CMD) in different areas.

We set off at 5.30am in the morning; the first stop was Lake Victoria to catch a ferry to the Sesse Islands. The team consisted of me, the driver (Bosco), research assistant (Gerald Adiga) and research technician (Joseph). Along the road, we saw several accidents, sadly a far too common occurrence in Uganda…

Due to delays, the ferry was rammed, and by the time we arrived it was almost the evening. We raced to the agricultural school with the field trial. Here the team have planted blocks of 25 clean cassava varieties from five African countries and our job was to score them for disease symptoms. CBSD and CMD are not very common on the Sesse Islands, and so most of the plants were healthy.
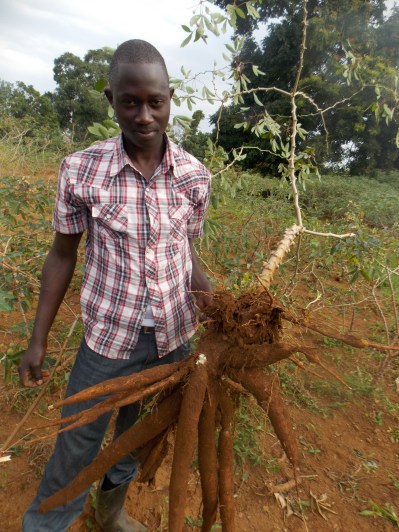
An agricultural student digs up a healthy cassava plant.
After a night of drinking Guinness in a corner shop we headed out, again at 5.30am! This time we headed to the city of Mbarara in the western region. The drive was really beautiful, passing Lake Mburo National Park and mountains covered with matoke.

Whilst scoring the cassava plants here we noticed a super abundance of whiteflies, which carry CBSD viruses. The weather had been particularly dry, allowing the whiteflies to breed like crazy. Fortunately, CBSD is also uncommon in this area and very few plants were diseased.
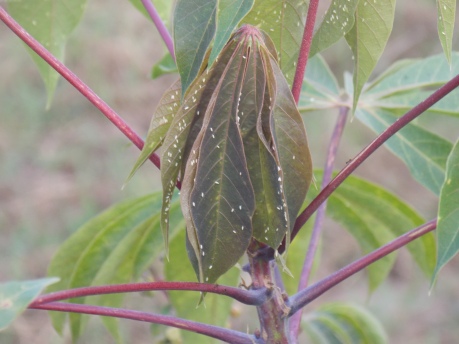
Super abundance of whiteflies on cassava which carry CBSD viruses.
The data from the 5CP project will help farmers to decide which cassava varieties offer the most protection against CBSD and CMD in their local areas; helping to protect them from the devastating yield losses caused by these diseases.

Fun stuff


On the way back we passed the equator line, and I got the chance to take some touristy photos. This week I also saw the Ndere dance troupe, who showcase the different dance and music styles from all over Uganda and other neighbouring countries. It was a lot of fun, some dances bared a weird resemblance to morris dancing and marching brass bands!
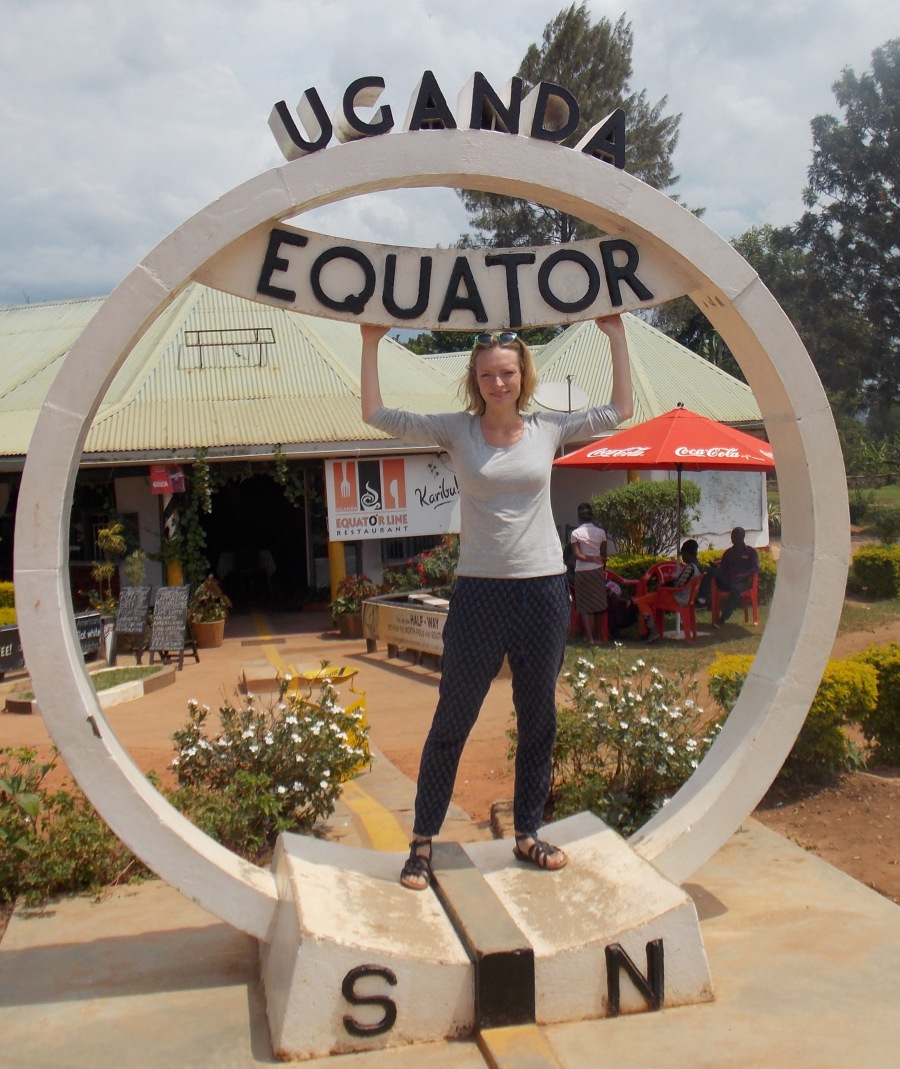
Crossing the equator!
-----------------------------------
This blog has been written by University of Bristol Cabot Institute member Katie Tomlinson from the School of Biological Sciences.  Katie's area of research is to generate and exploit an improved understanding of cassava brown streak disease (CBSD) to ensure sustainable cassava production in Africa.  This blog has been reposted with kind permission from Katie's blog Cassava Virus

Katie Tomlinson
More from this blog series:  

Popular posts from this blog

Converting probabilities between time-intervals

This is the first in an irregular sequence of snippets about some of the slightly more technical aspects of uncertainty and risk assessment.  If you have a slightly more technical question, then please email me and I will try to answer it with a snippet. Suppose that an event has a probability of 0.015 (or 1.5%) of happening at least once in the next five years. Then the probability of the event happening at least once in the next year is 0.015 / 5 = 0.003 (or 0.3%), and the probability of it happening at least once in the next 20 years is 0.015 * 4 = 0.06 (or 6%). Here is the rule for scaling probabilities to different time intervals: if both probabilities (the original one and the new one) are no larger than 0.1 (or 10%), then simply multiply the original probability by the ratio of the new time-interval to the original time-interval, to find the new probability. This rule is an approximation which breaks down if either of the probabilities is greater than 0.1. For example

1-in-200 year events

You often read or hear references to the ‘1-in-200 year event’, or ‘200-year event’, or ‘event with a return period of 200 years’. Other popular horizons are 1-in-30 years and 1-in-10,000 years. This term applies to hazards which can occur over a range of magnitudes, like volcanic eruptions, earthquakes, tsunamis, space weather, and various hydro-meteorological hazards like floods, storms, hot or cold spells, and droughts. ‘1-in-200 years’ refers to a particular magnitude. In floods this might be represented as a contour on a map, showing an area that is inundated. If this contour is labelled as ‘1-in-200 years’ this means that the current rate of floods at least as large as this is 1/200 /yr, or 0.005 /yr. So if your house is inside the contour, there is currently a 0.005 (0.5%) chance of being flooded in the next year, and a 0.025 (2.5%) chance of being flooded in the next five years. The general definition is this: ‘1-in-200 year magnitude is x’ = ‘the current rate for eve

Coconuts and climate change

Before pursuing an MSc in Climate Change Science and Policy at the University of Bristol, I completed my undergraduate studies in Environmental Science at the University of Colombo, Sri Lanka. During my final year I carried out a research project that explored the impact of extreme weather events on coconut productivity across the three climatic zones of Sri Lanka. A few months ago, I managed to get a paper published and I thought it would be a good idea to share my findings on this platform. Climate change and crop productivity  There has been a growing concern about the impact of extreme weather events on crop production across the globe, Sri Lanka being no exception. Coconut is becoming a rare commodity in the country, due to several reasons including the changing climate. The price hike in coconuts over the last few years is a good indication of how climate change is affecting coconut productivity across the country. Most coconut trees are no longer bearing fruits and thos