

The ship’s roll reaches 19° and everything falls off the desk, nearly followed by me off my chair if it weren’t for an evasive leap to one side. My roommate wakes with a start as the curtains around his bed have flung themselves open. “What are you doing?” he asks, in a confused state. Aside from the fact that everything falling off the desk was the weather’s fault, not mine, his question is a good one.
What are a team of 20 scientists, mostly from the UK, doing out here in the Southern Ocean? Surely there’s somewhere closer to home we could measure the sea. The main aim of this research cruise is to understand the process of deep water formation around Antarctica. First, let me briefly explain what deep water formation is and why it’s important in about 300 words. To understand this, the most important thing to remember is that water becomes denser when it is colder and/or when it is saltier. I think they teach that in GCSE science; if they don’t, they should.
Deep water formation
Antarctica is pretty cold, obviously. Where we are now, the sea temperature is around 1 °C. If we were to go further south or wait until winter, the sea will approach its freezing point of around -2 °C, forming sea ice. That’s a little colder than normal water, which freezes at 0 °C, because the sea is salty. However, when the sea freezes to form sea ice, the salt from the water is not incorporated into the ice – the salt that was in the sea water is left behind, making the remaining water a little bit saltier. As a result, the water close to the sea ice edge is both cold and salty compared to the rest of the world’s oceans, and therefore is denser than most of the rest of the world’s oceans. Dense water sinks below less dense water, and so the deepest water at the bottom of the oceans around the world all comes from around Antarctica. |
| Sea ice drifting close to the tip of the Antarctic Peninsula |
When the water is at the surface of the sea, it can absorb heat and gases, including carbon dioxide, from the atmosphere. When deep water formation occurs, this heat and carbon dioxide can be drawn down into the depths of ocean, where it will stay for 1000 years or so. The research cruise I am on now wants to measure the amount of deep water formation occurring so we can better understand how much heat and carbon dioxide is being taken up by the ocean, which helps understand how much the climate will change in the future with global warming. That’s why we are here, basically, instead of the Bristol Channel.
Chlorofluorocarbons
Our team, based at the University of Exeter, are specifically measuring CFCs in the water. CFCs (chlorofluorocarbons) are manmade gases that were used for many industrial and commercial processes for a few decades before people realised they were destroying ozone in the atmosphere. This was creating a hole in the Earth’s ozone layer in the stratosphere over Antarctica and the Southern Hemisphere. Ozone is important for absorbing some of the Sun’s strong and damaging ultraviolet radiation before it reaches the Earth’s surface. Excessive ultraviolet radiation causes sunburn and skin cancer in humans, so people were concerned about the ozone hole when it was discovered in the 1980s. As a result, all nations of the world agreed the Montreal Protocol to stop producing CFCs that were destroying the ozone layer. Although this was a geopolitical and diplomatic success story, the ozone hole is only slowly showing signs of recovering and some CFCs still seem to be increasing (presumably suggesting some illegal production of them still occurs). However, luckily the ozone hole is no longer getting bigger and it is mostly contained to the very high Southern Hemisphere. Don’t worry, I brought plenty of factor 50 for my pasty Irish skin.The reason we are measuring CFCs, however, is not actually to understand what they are doing to the ozone layer. We care about CFCs because they are manmade gases that are not naturally found in the atmosphere or ocean. This allows them to be used to trace ocean circulation and processes such as deep water formation. Let me explain how.
Jetsam
Since setting off from the Falklands five weeks ago, we have seen two manmade things: a ship on the horizon and some rusty metal oil barrels floating around amongst a heavy scattering of icebergs. The ship was a fishing boat, not far from the Falklands or Punta Arenas, so was not too surprising. The oil barrels however, were a bit more unexpected. They were floating right in the middle of the Weddell Sea, almost as far from civilisation as they could be. There were at least four of them, however they weren’t lashed together like some sort of raft made by Tom Hanks, they were all floating individually within a few hours steam of each other. |
| Oil barrel floating in the Weddell Sea, originally dumped around 6,000 km away (image credit: Hugh Venables, BAS) |
The most curious thing about these barrels, however, is that when we were able to zoom in on a photo taken of one with a camera with a good telephoto lens, we could see their origin. They had writing and the branding from Operation Deepfreeze, a US mission to set up an Antarctic base in the Ross Sea in the 1950s. After initially being surprised at seeing any litter in the pristine Southern Ocean, we had to question how these barrels got here. The Ross Sea is on the entire other side of the Antarctic continent, around 6,000 km away by sea.
The Operation Deepfreeze base was built on the Ross Ice Shelf. This is thick ice that has flown out from the glaciers on land to create an area the size of France floating over the Ross Sea. Although this ice is very thick and reasonably slow moving, it is not permanent and does break off from time to time to form huge icebergs. The same process has formed some icebergs that have made the news recently, including one berg a quarter of the size of Wales and a potential berg break off that is threatening to take the British Antarctic Survey’s Halley research station with it. Well, presumably the old dumping ground from Operation Deepfreeze has at some stage broken off from the Ross Ice Shelf, floated halfway around the Southern Ocean carried by the Antarctic Circumpolar Current and been taken into the Weddell Sea gyre, where it melted and broke up, scattering all the rubbish into the Weddell Sea.
Just like these oil barrels can be used to trace how the ocean’s surface currents circulate (a similar story involves a spilt shipping container of rubber ducks in the Pacific Ocean in 1992), looking at where manmade gases such as CFCs end up in the deep ocean can tell us how the deep water formation takes water from the surface to depth. To measure the CFCs, we first take samples using a probe known as a CTD (which stands for Conductivity Temperature Depth). This probe has 24 bottles on it as well as instruments for measuring of salinity, temperature and other water properties. The probe is lowered to the bottom of the ocean (which around here can be more than 6 km deep) and as it is brought back up to the surface, the 24 bottles are closed at different depths. When the CTD arrives back on the ship’s deck, we then have samples of water from 24 depths through the ocean at that particular location. Over the course of the cruise, we will be carrying out around 100 CTDs.
 |
| Sampling using the CTD (lowered by winch off the side of the ship) continues morning, noon and night, meaning we work 12 hour shifts |
With the water brought up in the bottles, our team takes a 500 ml sample from each and we store them in a walk-in fridge on the ship. We then analyse one sample at a time, which takes about 20 minutes using a custom-built machine that strips all the gases out of the water and calculates the amount of CFCs it contains. This setup for measuring CFCs is in its own portable lab, built in a shipping container that it strapped onto the aft deck of the James Clark Ross. While it’s pretty time-consuming running 100 CTDs with 24 bottles each taking 20 minutes (I calculate that to be more than 33 days of continually running the machine, assuming no delays) at least we have a good view from our container out over the wildlife and icebergs of the Southern Ocean.
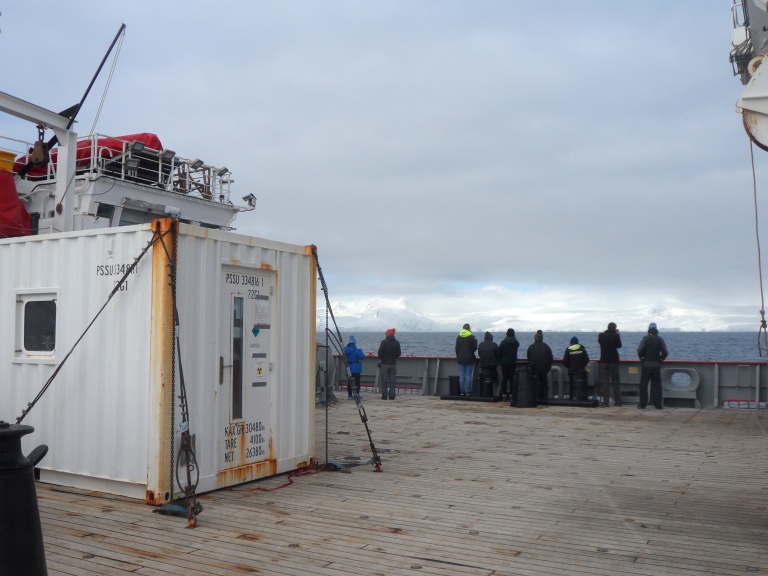 |
| Our CFC lab inside a shipping container, strapped onto the aft deck, as we sail by the South Orkney Islands |
Other science
Besides our team measuring CFCs, other scientists are also using the water from the CTD to analyse oxygen isotopes, nutrient content, pH and microbes. When the CTD comes on deck, there is usually a bit of a mad scramble as everyone gets water for their own analysis, with a strict pecking order as who gets to take their water first. For maximum inconvenience, usually the CTD comes up just before dinner or lunch, just to make sampling that little bit more frantic. |
| Taking water samples for analysis from the 24 bottles on the CTD once it is back on deck (image credit: Charel Wohl, PML) |
As well as measuring water from depth using the CTD, other scientists on the ship also continually measure the air and surface sea water as we sail. The air measurements, taken from the very front of the ship so not to get contaminated by exhaust or air conditioning fumes, must be measuring some of the cleanest air in the world. It’s pretty nice to stand up there and breathe it in, although it’s often accompanied by a blizzard of snow and biting wind, which makes the experience slightly less enjoyable.
We also have deployed some floats that will continue to measure the salinity and temperature of the sea here for the next five years or so. Using a gas bladder, these floats can adjust their density so they rise and sink through the ocean, measuring continually as they go. Every time these floats get back to the surface, they send their data back via a satellite connection. Although they don’t measure as much stuff as the scientists on the ship (for example, they don’t measure CFCs), they will be here all year round so keep making measurements through the winter. The ship on the other hand will have to retreat from the sea ice before the winter sets in, in case we end up repeating Shackleton’s antics with the Endurance. Which is fine with me because, interesting as it is, I don’t really fancy a further 6 months down here in the dark.
 |
| A float being deployed, which will continue to make measurements through the winter and for years after we leave |
This blog is part of a blog series from Antarctica by Alan Kennedy-Asser, who has recently completed his PhD at the University of Bristol. This blog has been republished with kind permission from Alan. View the original blog. You can follow Alan on Twitter @EzekielBoom.
 |
| Alan Kennedy-Asser |
Read part one of Alan's Antarctica blog series - Antarctica: Ship life
Read part two of Alan's Antarctica blog series - Antarctica: Why are we here again?
Read part three of Alan's Antarcica blog series: Antarctica: Looking back