
Since being universally ratified in the 1980s, the Montreal Protocol – the treaty charged with healing the ozone layer – has been wildly successful in causing large reductions in emissions of ozone depleting substances. Along the way, it has also averted a sizeable amount of global warming, as those same substances are also potent greenhouse gases. No wonder the ozone process is often held up as a model of how the international community could work together to tackle climate change.
However, new research we have published with colleagues in Nature shows that global emissions of the second most abundant ozone-depleting gas, CFC-11, have increased globally since 2013, primarily because of increases in emissions from eastern China. Our results strongly suggest a violation of the Montreal Protocol.
A global ban on the production of CFCs has been in force since 2010, due to their central role in depleting the stratospheric ozone layer, which protects us from the sun’s ultraviolet radiation. Since global restrictions on CFC production and use began to bite, atmospheric scientists had become used to seeing steady or accelerating year-on-year declines in their concentration.
But bucking the long-term trend, a strange signal began to emerge in 2013: the rate of decline of the second most abundant CFC was slowing. Before it was banned, the gas, CFC-11, was used primarily to make insulating foams. This meant that any remaining emissions should be due to leakage from “banks” of old foams in buildings and refrigerators, which should gradually decline with time.
But in that study published last year, measurements from remote monitoring stations suggested that someone was producing and using CFC-11 again, leading to thousands of tonnes of new emissions to the atmosphere each year. Hints in the data available at the time suggested that eastern Asia accounted for some unknown fraction of the global increase, but it was not clear where exactly these emissions came from.
But all was not quite right at two stations: one on Jeju Island, South Korea, and the other on Hateruma Island, Japan.
These sites showed “spikes” in concentration when plumes of CFC-11 from nearby industrialised regions passed by, and these spikes had got bigger since 2013. The implication was clear: emissions had increased from somewhere nearby.
To further narrow things down, we ran computer models that could use weather data to simulate how pollution plumes travel through the atmosphere.
From the simulations and the measured concentrations of CFC-11, it became apparent that a major change had occurred over eastern China. Emissions between 2014 and 2017 were around 7,000 tonnes per year higher than during 2008 to 2012. This represents more than a doubling of emissions from the region, and accounts for at least 40% to 60% of the global increase. In terms of the impact on climate, the new emissions are roughly equivalent to the annual CO₂ emissions of London.
The most plausible explanation for such an increase is that CFC-11 was still being produced, even after the global ban, and on-the-ground investigations by the Environmental Investigations Agency and the New York Times seemed to confirm continued production and use of CFC-11 even in 2018, although they weren’t able to determine how significant it was.
While it’s not known exactly why production and use of CFC-11 apparently restarted in China after the 2010 ban, these reports noted that it may be that some foam producers were not willing to transition to using second generation substitutes (HFCs and other gases, which are not harmful to the ozone layer) as the supply of the first generation substitutes (HCFCs) was becoming restricted for the first time in 2013.
While this story demonstrates the critical value of atmospheric monitoring networks, it also highlights a weakness of the current system. As pollutants quickly disperse in the atmosphere, and as there are only so many measurement stations, we were only able to get detailed information on emissions from certain parts of the world.
Therefore, if the major sources of CFC-11 had been a few hundred kilometres further to the west or south in China, or in unmonitored parts of the world, such as India, Russia, South America or most of Africa, the puzzle would remain unsolved. Indeed, there are still parts of the recent global emissions rise that remain unattributed to any specific region.
When governments and policy makers are armed with this atmospheric data, they will be in a much better position to consider effective measures. Without it, detective work is severely hampered.
---------------------------
This blog is written by Cabot Institute member Dr Matt Rigby, Reader in Atmospheric Chemistry, University of Bristol; Luke Western, Research Associate in Atmospheric Science, University of Bristol, and Steve Montzka, Research Chemist, NOAA ESRL Global Monitoring Division, University of Colorado. This article is republished from The Conversation under a Creative Commons license. Read the original article.
Listen Matt Rigby talk about CFC emissions on BBC Radio 4's Inside Science programme.
However, new research we have published with colleagues in Nature shows that global emissions of the second most abundant ozone-depleting gas, CFC-11, have increased globally since 2013, primarily because of increases in emissions from eastern China. Our results strongly suggest a violation of the Montreal Protocol.
A global ban on the production of CFCs has been in force since 2010, due to their central role in depleting the stratospheric ozone layer, which protects us from the sun’s ultraviolet radiation. Since global restrictions on CFC production and use began to bite, atmospheric scientists had become used to seeing steady or accelerating year-on-year declines in their concentration.
 |
| Ozone-depleting gases, measured in the lower atmosphere. Decline since the early 1990s is primarily due to the controls on production under the Montreal Protocol. AGAGE / CSIRO |
But bucking the long-term trend, a strange signal began to emerge in 2013: the rate of decline of the second most abundant CFC was slowing. Before it was banned, the gas, CFC-11, was used primarily to make insulating foams. This meant that any remaining emissions should be due to leakage from “banks” of old foams in buildings and refrigerators, which should gradually decline with time.
But in that study published last year, measurements from remote monitoring stations suggested that someone was producing and using CFC-11 again, leading to thousands of tonnes of new emissions to the atmosphere each year. Hints in the data available at the time suggested that eastern Asia accounted for some unknown fraction of the global increase, but it was not clear where exactly these emissions came from.
Growing ‘plumes’ over Korea and Japan
Scientists, including ourselves, immediately began to look for clues from other measurements around the world. Most monitoring stations, primarily in North America and Europe, were consistent with gradually declining emissions in the nearby surrounding regions, as expected.But all was not quite right at two stations: one on Jeju Island, South Korea, and the other on Hateruma Island, Japan.
These sites showed “spikes” in concentration when plumes of CFC-11 from nearby industrialised regions passed by, and these spikes had got bigger since 2013. The implication was clear: emissions had increased from somewhere nearby.
To further narrow things down, we ran computer models that could use weather data to simulate how pollution plumes travel through the atmosphere.
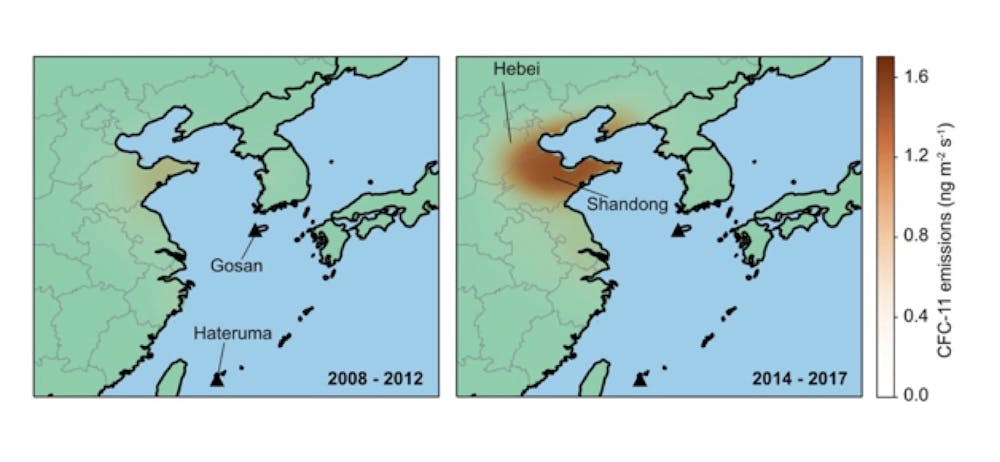 |
| Atmospheric observations at Gosan and Hateruma monitoring stations showed an increase in CFC-11 emissions from China, primarily from Shandong, Hebei and surrounding provinces. Rigby et al, Author provided |
From the simulations and the measured concentrations of CFC-11, it became apparent that a major change had occurred over eastern China. Emissions between 2014 and 2017 were around 7,000 tonnes per year higher than during 2008 to 2012. This represents more than a doubling of emissions from the region, and accounts for at least 40% to 60% of the global increase. In terms of the impact on climate, the new emissions are roughly equivalent to the annual CO₂ emissions of London.
The most plausible explanation for such an increase is that CFC-11 was still being produced, even after the global ban, and on-the-ground investigations by the Environmental Investigations Agency and the New York Times seemed to confirm continued production and use of CFC-11 even in 2018, although they weren’t able to determine how significant it was.
While it’s not known exactly why production and use of CFC-11 apparently restarted in China after the 2010 ban, these reports noted that it may be that some foam producers were not willing to transition to using second generation substitutes (HFCs and other gases, which are not harmful to the ozone layer) as the supply of the first generation substitutes (HCFCs) was becoming restricted for the first time in 2013.
Bigger than the ozone hole
Chinese authorities have said they will “crack-down” on any illegal production. We hope that the new data in our study will help. Ultimately, if China successfully eliminates the new emissions sources, then the long-term negative impact on the ozone layer and climate could be modest, and a megacity-sized amount of CO₂-equivalent emissions would be avoided. But if emissions continue at their current rate, it could undo part of the success of the Montreal Protocol.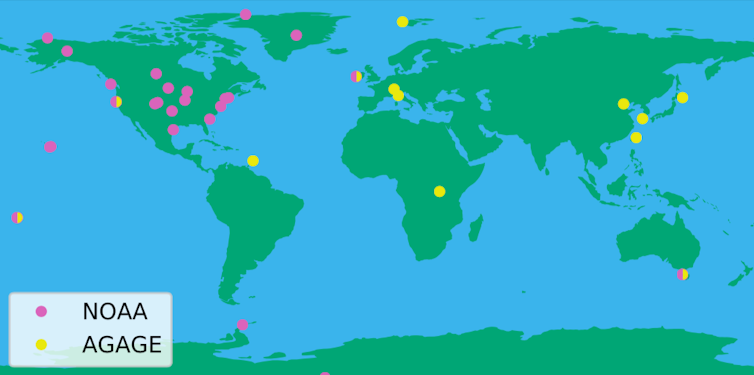 |
| The network of global (AGAGE) and US-run (NOAA) monitoring stations. Luke Western, Author provided |
While this story demonstrates the critical value of atmospheric monitoring networks, it also highlights a weakness of the current system. As pollutants quickly disperse in the atmosphere, and as there are only so many measurement stations, we were only able to get detailed information on emissions from certain parts of the world.
Therefore, if the major sources of CFC-11 had been a few hundred kilometres further to the west or south in China, or in unmonitored parts of the world, such as India, Russia, South America or most of Africa, the puzzle would remain unsolved. Indeed, there are still parts of the recent global emissions rise that remain unattributed to any specific region.
When governments and policy makers are armed with this atmospheric data, they will be in a much better position to consider effective measures. Without it, detective work is severely hampered.
---------------------------
This blog is written by Cabot Institute member Dr Matt Rigby, Reader in Atmospheric Chemistry, University of Bristol; Luke Western, Research Associate in Atmospheric Science, University of Bristol, and Steve Montzka, Research Chemist, NOAA ESRL Global Monitoring Division, University of Colorado. This article is republished from The Conversation under a Creative Commons license. Read the original article.
 |
| Matt Rigby |